
Install
Inside DeepSeek Harness, with dsh-market
dsh plugin --profile web add dshmarket
Or from the command line
dsh plugin --profile web add dsh-spend
Installing runs third-party code with your own permissions — it can read your files, use your credentials and reach the network. Review the source first, and pin a commit (github:owner/repo#sha) when you can.
Screenshots
README
Token usage & cost monitor for DeepSeek Harness — floating widget with multi-dimensional stats, time-series charts, auto-detected billing plans (Code/Token) and estimated spend.
简体中文 | English
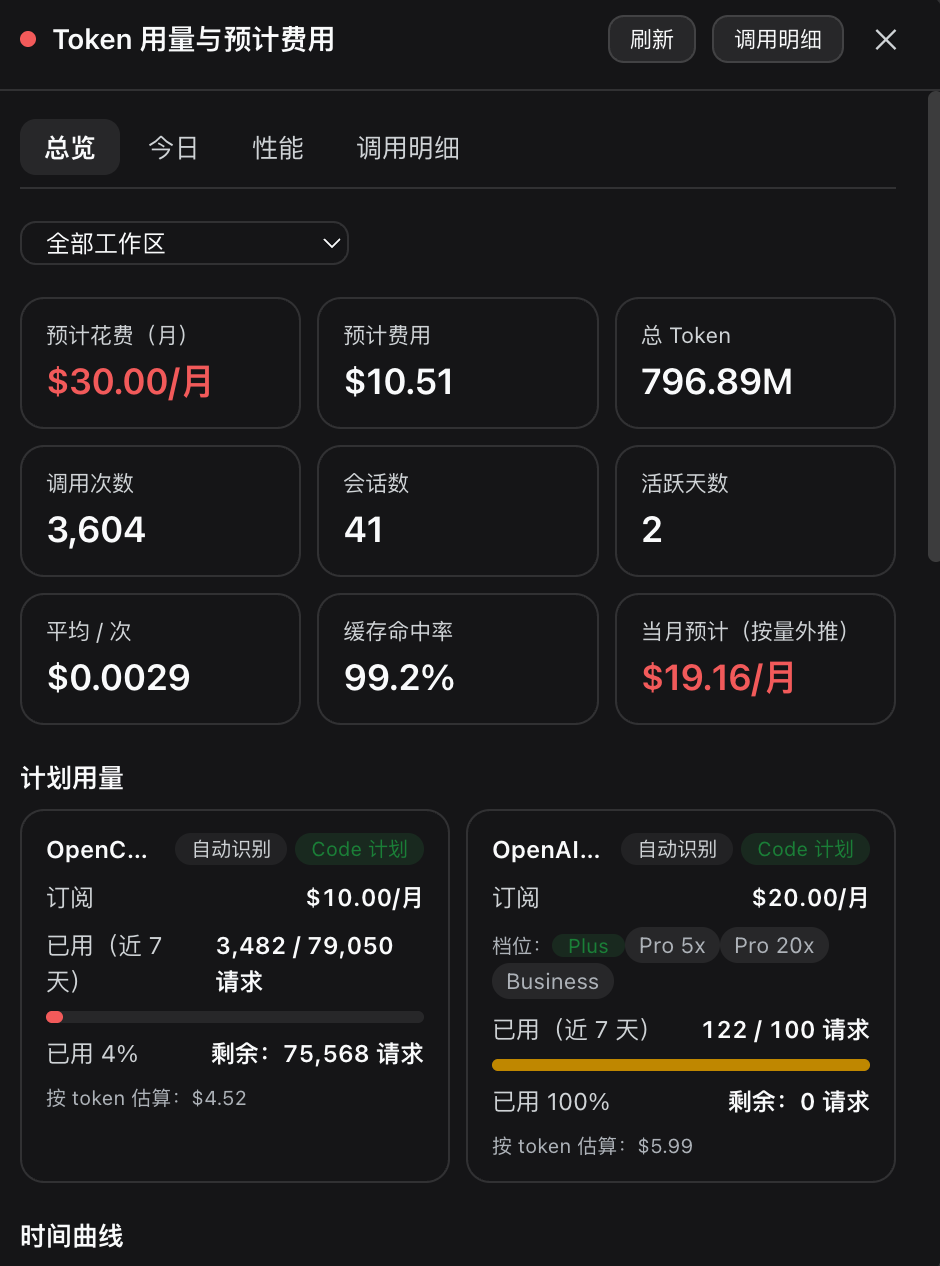
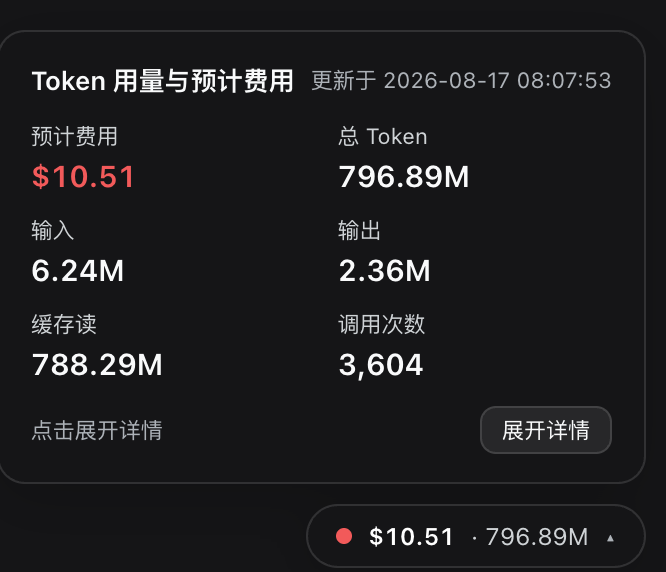
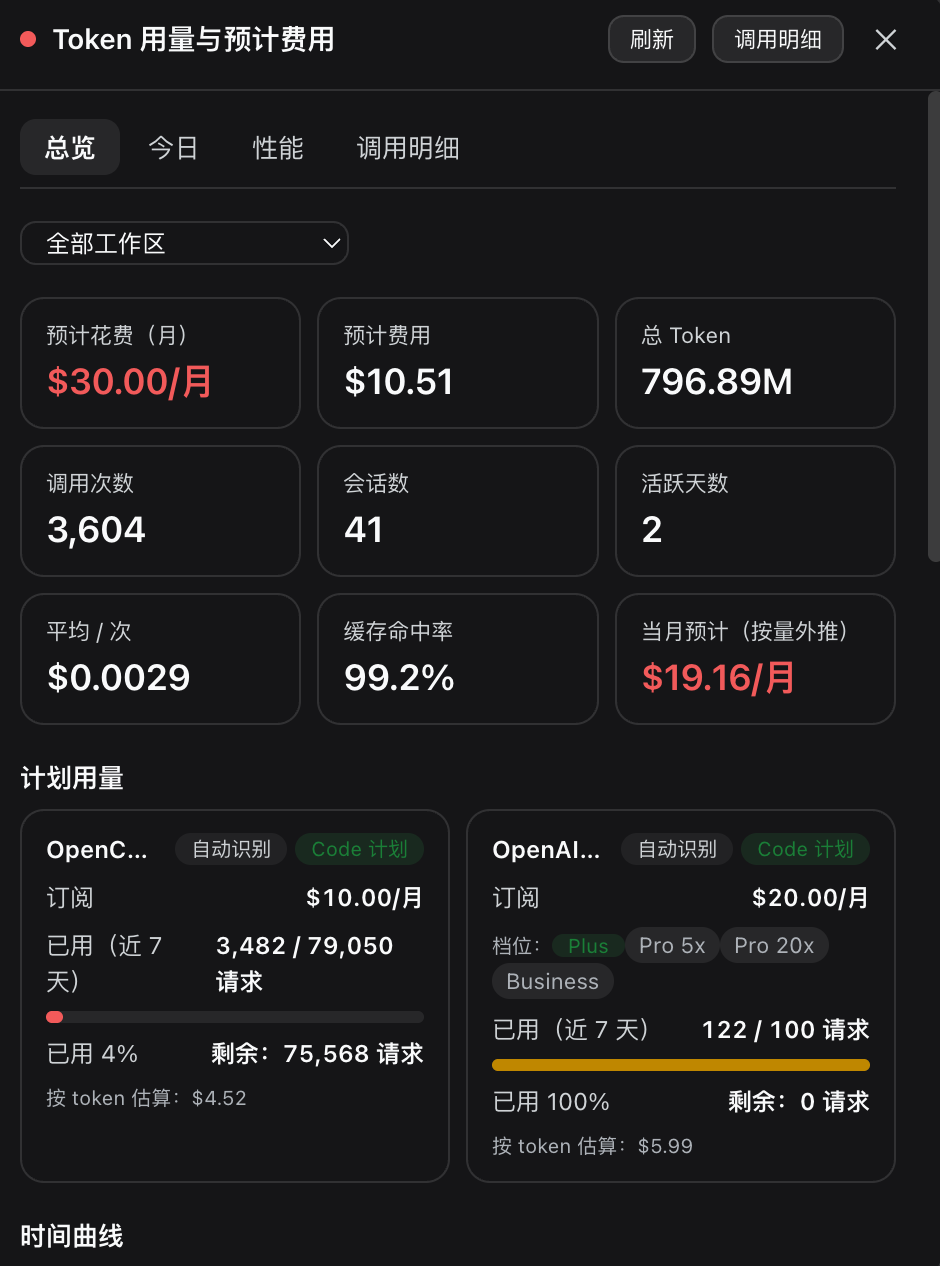
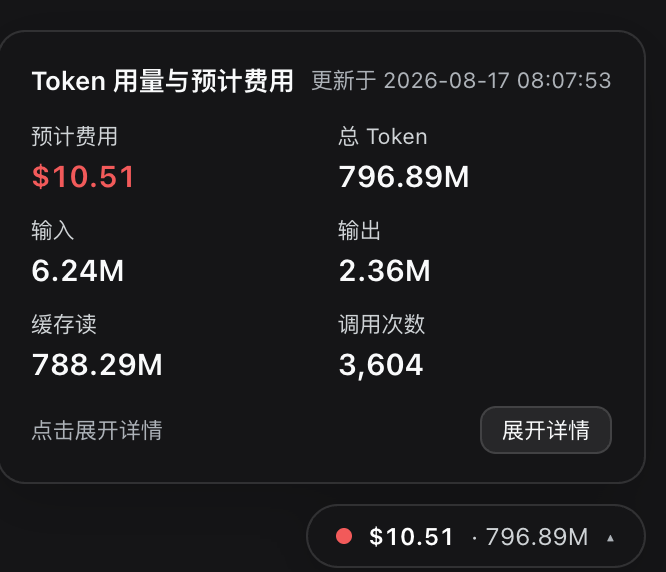
A floating usage widget pinned to the bottom-right corner of the dsh Web UI: token volume, multi-dimensional statistics, time-series charts, auto-detected billing plans and estimated monthly spend — zero configuration required, with live quota/balance read straight from the subscription vendors.
Table of contents
- Highlights
- Screenshots
- Interactions
- Provider auto-detection (zero configuration)
- How it works
- Installation
- Configuration
- Rate sources & cost model
- Repository layout
- Notes & limitations
Highlights
- 🖱️ Three-level interaction: persistent floating pill → hover summary preview → click for a four-tab dashboard
- 📊 Multi-dimensional stats: by provider / model / hour / day / session / working directory / recent calls, plus performance metrics (TTFT, generation speed)
- 📈 Time-series charts: today hour-by-hour, 24h/72h/7d curves, 52-week activity heatmap
- 🏷️ Auto-detected billing plans: built-in knowledge base (17 providers / 131 model rate cards), distinguishes subscription (Code) from pay-as-you-go (Token)
- 🔴 Live quota & balance: 9 built-in adapters (7 quota + 2 balance) showing the vendor's real reported values, fail-safe fallback, never crashes
- ⚡ DeepSeek peak/off-peak pricing: since 8/17 each call is priced by its own timestamp (peak/off-peak schedule)
- 💱 $ / ¥ currency switch: live USD→CNY quote (falls back to
usdCnyRate, default 7.2) - 📂 Workspace filter: scope every dimension to one project, drill down into subdirectories
- 📤 Data export: call details exportable as CSV / JSON / call-log CSV, viewable in a separate window
- 🔁 Auto-refresh: every 30s by default (server-side interval, no frontend change needed); manual refresh available in-panel
Screenshots
Interactions
| Level | What you get |
|---|---|
| Floating pill (bottom-right) | always shows estimated cost and total tokens (turns amber at 80% / red at 100% of budget) |
| Hover | summary preview: cost, tokens, input / output / cache-read, call count, today's subtotal |
| Click | expands the dashboard into four tabs; a workspace filter dropdown on top scopes every dimension to one project (drill down into subdirectories); a $ / ¥ currency switch sits at the right end of the tab bar (same switch in the hover preview) — rate comes from a live quote fetched by the host (falls back to the fixed usdCnyRate) |
The four tabs
- Overview (pure KPI + ranking summary, no charts):
- Billing bar: estimated monthly spend + composition, projected month-end usage spend, token estimate, total tokens, calls, sessions, avg cost / call, cache hit rate, optional monthly budget (pill turns amber at 80%, red at 100%), and active days / day streak;
- Plans: auto-detected Code/Token plans with tiers, quota used & remaining;
- Top providers / top models by cost (6 rows each) + the 31-day trend.
- Today: today's calls, tokens and cost summary + an hour-by-hour token / cost chart (the x-axis starts at today's first hour with usage, so idle overnight hours don't stretch the chart; a day without usage collapses to the current hour) + the time series (24h by default, switchable to 24h / 72h / 7d; the x-axis starts at the first hour with usage inside the range, and shows dates when the day changes) + the activity heatmap (52 weeks, GitHub-style, cell depth = daily token volume, hover for tokens / cost / calls).
- Performance: per-model time-to-first-token (TTFT) avg / P50 / P90, generation speed (tokens/s) and average latency, plus hourly TTFT / speed curves (same 24h / 72h / 7d range switch, also starting at the first hour with samples).
- Call details: calls, tokens and cost per session × model, plus by-working-directory stats (sessions / models / calls / cost per project), by-session stats, recent calls (cost anomalies far above the mean flagged with a red dot) and the rate table — all also openable in a separate window that auto-refreshes with the main one and offers CSV / JSON / call-log CSV export.
Provider auto-detection (zero configuration)
The plugin ships a built-in provider knowledge base (lib/knowledge.js, verified against official docs on 2026-08-14) covering 17 providers / 131 model rate cards. Provider ids are normalized through an alias table (glm→zhipu, kimi→moonshot, dashscope→qwen, gemini→google, grok→xai, claude→anthropic, copilot→github-copilot, minimax-cn→minimax, deepseek-official→deepseek, …). Providers that appear in your session logs are matched automatically (badged "auto" in the UI); an explicit plans / pricing config always overrides auto-detection.
Subscription (Code) plans — auto-detected with fees and quotas
| Provider | Default tier | Tiers | Quota |
|---|---|---|---|
OpenCode Go (opencode-go) |
$10/mo | — | Live quota (official GET /zen/go/v1/usage: actual 5h/week/month percent + reset); falls back to $30/week (~79,050 req/wk for V4 Flash) when the endpoint is unreachable |
OpenAI Codex (openai-codex) |
Plus $20/mo | Plus / Pro 5x $100 / Pro 20x $200 / Business | Live quota (chatgpt.com/backend-api/wham/usage; needs ~/.codex/auth.json login on this machine; falls back to ~100 req/wk) |
GitHub Copilot (github-copilot) |
Pro $10/mo | Free / Pro / Pro+ $39 / Max $100 / Business / Enterprise | Live quota (api.github.com/copilot_internal/user; needs GH_TOKEN/GITHUB_TOKEN or gh auth login; falls back to AI Credits $15/mo) |
Claude Code (claude-sub) |
Pro $20/mo | Pro / Max 5x $100 / Max 20x $200 | Live quota (api.anthropic.com/api/oauth/usage; needs ~/.claude/.credentials.json login on this machine; falls back to the tier table) |
ZhipuAI Coding Plan (zhipu) |
official plan | — | Live quota (official bigmodel.cn/api/monitor/usage/quota/limit: 5h/week percent + reset, MCP monthly counts; credential seam ZHIPU_API_KEY; international site z.ai via a usageEndpoints URL override) |
MiniMax Token Plan (minimax) |
official plan | — | Live quota (official minimaxi.com/v1/token_plan/remains: 5h/week remaining percent + reset; credential seam MINIMAX_API_KEY, fallback MINIMAX_CN_API_KEY; international site minimax.io via a usageEndpoints URL override) |
ClinePass (clinepass) |
official plan | — | Live quota (official api.cline.bot/v1/users/me/plan/usage-limits: 5h/weekly/monthly percent + reset; credential seam CLINEPASS_API_KEY) |
Google AI / Gemini CLI (google-ai-sub) |
AI Pro $19.99/mo | AI Pro / Ultra 5x $99.99 / Ultra 20x $199.99 | no public usage endpoint; shows the official daily caps (1,500 / 2,000 req/day) |
Pay-as-you-go (Token) plans — auto-priced with official rates
| Provider | Models in knowledge base |
|---|---|
OpenAI (openai) |
gpt-5.6 sol/terra/luna, gpt-5.5, gpt-5.4 family, gpt-5 family, gpt-5.2, o3/o4-mini/o1 |
Anthropic (anthropic) |
claude-opus-5, sonnet-5, haiku-4-5, fable-5, opus/sonnet-4.x |
Google (google) |
gemini-3.7/3.6/3.5 flash, 3.1-pro, 2.5 pro/flash/lite |
xAI (xai) |
grok-4.6, 4.5, 4.3, build-0.1 |
Mistral (mistral) |
large-3, medium-3.5, small-4, ministral-3 |
Moonshot (moonshot) |
kimi-k3, k2.7-code |
Zhipu (zhipu) |
glm-5.2, 5.1, 5 |
Alibaba (qwen) |
qwen3.8-max, 3.7-max/plus/flash |
MiniMax (minimax) |
m3, m2.7 |
OpenRouter (openrouter) |
50 live-catalog models |
OpenCode Zen (opencode-zen) |
PAYG gateway rates (Claude/GPT/Gemini/Grok/DeepSeek) |
DeepSeek (deepseek) |
v4-flash, v4-pro |
Live quota & balance (vendor-direct)
Built-in adapters (lib/providers/, endpoints & auth verified 2026-08-25):
- Quota (subscription Code plans): OpenCode Go / OpenAI Codex / Claude Code / GitHub Copilot / ZhipuAI Coding Plan / MiniMax Token Plan / ClinePass — the plan card shows the vendor's own reported values: actual percent used per window (5h / week / month) plus the reset time, plus vendor-specific shares (Codex code review, Claude Opus/Design weekly windows, Copilot Premium/Chat snapshots, Zhipu MCP monthly counts);
- Balance (Token plans): DeepSeek / Moonshot — real account balance (wallet available + top-up/granted split, converted automatically with the $/¥ switch).
Credentials are reused read-only from local CLI logins and the credentials seam:
| Provider | Credential source |
|---|---|
| OpenCode Go / DeepSeek / Zhipu / MiniMax / ClinePass / Moonshot | env or credentials seam: OPENCODE_GO_API_KEY / DEEPSEEK_API_KEY / ZHIPU_API_KEY / MINIMAX_API_KEY (fallback MINIMAX_CN_API_KEY) / CLINEPASS_API_KEY / MOONSHOT_API_KEY |
| OpenAI Codex | local ~/.codex/auth.json login |
| Claude Code | local ~/.claude/.credentials.json login |
| GitHub Copilot | GH_TOKEN / GITHUB_TOKEN / gh config |
Wallet cards appear automatically: when the credentials seam ($DSH_HOME/.credentials.yaml) holds DEEPSEEK_API_KEY / MOONSHOT_API_KEY, a token-plan card is auto-created even when that provider never appears in the session logs (e.g. usage rides through a gateway), showing the real account balance. Missing login or endpoint failure shows the reason and falls back to the local quota rows. The Codex/Claude/Copilot endpoints (chatgpt.com, api.anthropic.com, api.github.com) are reverse-engineered and may change; failures never crash the widget.
Cost model: Code plans count their subscription fee, Token plans their estimated usage, into the "estimated monthly spend"; the raw "token estimate" stays visible for comparison. Plans without a published quota (e.g. Claude Code) show the tier table instead of a progress bar; quotas are measured over the official period (day/week/month).
How it works
- Host plugin (
lib/index.js) registers a Typert Remote serviceusageStats(discovered by the gateway's SRC reflection — no generated descriptor files). - Browser half (
lib/client.js) bypasses typert namespaces and calls the host gateway directly withctx.connection.rpc.call("/api", "usageStats/query", ...)— the same carrier generated namespaces use, so no inject declaration for a self-created namespace is needed. - The floating widget renders through its own React root on
document.body(position: fixed; right: 20px; bottom: 20px) and is removed on plugin unload. - Data replay: session logs under
$DSH_HOME/sessionsare replayed frame by frame (zstd) using the same semantics as the harness token-meter:assistant/chunkusage is an early sample, theassistant/messageusage is the final sample for the same (turn, step) and replaces it, so nothing is double-counted; in-memory live-session events are merged on top. - Pricing: cost = Σ(bucket tokens × rate / 1e6); rates resolve per provider: exact (provider, model) row → generic model row → default fallback — every AI provider (e.g. opencode-go vs openai-codex) is billed at its own official rates.
- Dimensions: totals / by provider / by model / by hour (zero-filled continuous series for the charts) / by day / by session / recent calls / performance (per-step TTFT, tokens/s and latency, aggregated per model and per hour) / session × model details.
- Performance semantics: TTFT = request (
request/header) → first content chunk; generation window = first → last content chunk; tokens/s = output tokens ÷ generation window. Tool-loop follow-up steps have no separate request log, so their TTFT is estimated fromstep/start(samples carry anttftEstimatedflag). - Snapshot caching: snapshots are cached behind a signature of file sizes + mtimes + live event counts; unchanged data returns from cache.
Installation
The package ships a dsh.bundle manifest, so dsh plugin add mounts it as a profile layer automatically — no manual profile editing needed:
# 1. Install into the web profile (forwards to pnpm; accepts npm packages, github:owner/repo, or local paths)
dsh plugin --profile web add dsh-spend

# 2. Verify the row is mounted
dsh --profile web --dump-config | grep usage-stats

# 3. Restart dsh web (plugin code is not hot-reloaded)
dsh web
To install from source: dsh plugin --profile web add github:nonewind/dsh-spend (or a local path with -w).
Overriding defaults: the plugin's built-in provider knowledge base auto-detects pricing and billing plans (see above), so no config is usually required. To override, add an insert row with the same id (usage-stats) to ~/.dsh/profiles/web/cordis.patch.yml — the user layer applies after bundle layers and the same-id row wins (see config below).
Configuration
The config of the usage-stats row in cordis.patch.yml (shipping with official rates, see "Rate sources"):
config:
  currency: USD            # server base currency (costs are computed in USD; the UI can switch $ / ¥ freely)
  usdCnyRate: 7.2          # fixed USD→CNY rate (fallback when the live quote is unreachable)
  liveRate: true           # host refreshes a live USD→CNY quote (6h cache); false = always the fixed rate
  pricing:                 # per-model rates (per million tokens), exact match
    - model: deepseek-v4-flash
      inputPerMillion: 0.14
      outputPerMillion: 0.28
      cacheReadPerMillion: 0.0028
      cacheWritePerMillion: 0
  defaultPricing:          # fallback rates for unknown models
    inputPerMillion: 0.14
    outputPerMillion: 0.28
    cacheReadPerMillion: 0.0028
    cacheWritePerMillion: 0
  maxSessions: 20          # max rows in the by-session table
  maxRecentCalls: 50       # max recent calls
  seriesHours: 168         # time-series window in hours (zero-filled; UI offers 24h/72h/7d)
  refreshSeconds: 30       # auto-refresh interval in seconds (>= 5)
  monthlyBudget: 50        # optional monthly spend budget (same currency): used/remaining + alerts
  plans:                   # billing plans: Token Plan / Code Plan with usage & remaining
    - provider: opencode-go
      type: token          # pay-as-you-go: used cost (estimate); balance optional
      # balance: 100
    - provider: openai-codex
      type: code           # subscription quota: measured over the last periodDays
      quotaRequests: 100   # periodic request quota (or quotaTokens for token quota)
      periodDays: 7
  usageEndpoints:          # live subscription-provider quota endpoints (opencode-go built in)
    - provider: opencode-go
      url: https://opencode.ai/zen/go/v1/usage   # official quota endpoint (undocumented API)
      apiKeyEnv: OPENCODE_GO_API_KEY             # optional: credential name (default <PROVIDER>_API_KEY)
      timeoutMs: 15000                           # optional: fetch timeout
Live provider quota & balance: Code plans are read through the built-in adapters (
lib/providers/) — opencode-go (credentials seamOPENCODE_GO_API_KEY), openai-codex (~/.codex/auth.json), claude-sub (~/.claude/.credentials.json), github-copilot (GH_TOKEN/GITHUB_TOKEN/gh), zhipu (ZHIPU_API_KEY), minimax (MINIMAX_API_KEY, fallbackMINIMAX_CN_API_KEY), clinepass (CLINEPASS_API_KEY) — showing the vendor's per-window percent and reset time; token-plan balances come from deepseek (DEEPSEEK_API_KEY) and moonshot (MOONSHOT_API_KEY).usageEndpointsrows override the built-in URL/timeout or add a custom provider via the generic Bearer-key path (<PROVIDER>_API_KEY). Only when the login is missing or the endpoint fails (timeout, non-200) does the card fall back to the local quota rows, with the reason shown.
Pricing rows accept an optional
providerfield for exact provider matching (e.g.provider: openai-codex); rows without one apply to any provider serving that model; unmatched models fall back todefaultPricing. Token Plan "remaining" = configured prepaid balance − accumulated estimated cost; Code Plan "remaining" = quota − actual consumption in the period. Providers without aplansentry show no plan card (their cost is still shown in the by-provider table).
Rate sources & cost model
Rates come from the vendors' official pricing pages (verified 2026-08-14) and ship with the config; cost = Σ(bucket tokens × rate / 1e6). The table shows the pre-2026-08-17 legacy rates; from 8/17 DeepSeek is priced automatically with the peak/off-peak schedule (see the note below — works for both
deepseekanddeepseek-officialproviders):
| Model | Input (miss) | Input (cache hit) | Cache write | Output |
|---|---|---|---|---|
| deepseek-v4-flash | $0.14 | $0.0028 | 0* | $0.28 |
| deepseek-v4-pro | $0.435 | $0.003625 | 0* | $0.87 |
| gpt-5.6-sol | $5.00 | $0.50 | $6.25 | $30.00 |
| gpt-5.6-terra | $2.00 | $0.20 | $2.50 | $12.00 |
| gpt-5.6-luna | $0.20 | $0.02 | $0.25 | $1.20 |
- DeepSeek: official pricing (fetched 2026-08-14). *DeepSeek's disk cache is automatic and has no separate cache-write line item, hence
cacheWritePerMillion: 0. - OpenAI: official pricing (after the 2026-07-30 cuts); cache writes bill at 1.25× uncached input. Luna is down 80% ($1→$0.20 input / $6→$1.20 output).
- ⚡ DeepSeek peak/off-peak pricing is built in (effective 2026-08-17 00:00 +08:00; peak 09:00–12:00 / 14:00–18:00 local time, off-peak at half price): v4-flash peak $0.014 (hit) / $0.44 (miss) / $1.32 (output), off-peak halved; v4-pro peak $0.044 / $1.32 / $3.96, off-peak halved. A pricing row can carry a
schedule(effectiveAt+peakHours+peak/offPeakrates) — each call is priced by its own timestamp: legacy rates before 8/17, peak/off-peak after; historical calls are never re-priced (rate table rows show a "peak/off-peak" badge). - ⚠️ OpenCode Go is subscription-based (not token-billed): usage consumes the $10/month dollar quota (5h $12 / week $30 / month $60) instead of the token rates above — the "token estimate" is only a relative reference; real spend is the "estimated monthly spend" and the plan cards.
- If your provider bills through a proxy (not the official endpoint), override the model rates to match the proxy's actual billing.
Cost figures are estimates for reference only, not a bill (disclaimer also shown at the bottom of the page).
Repository layout
dsh-spend/
├── package.json          # dual-face declaration: dsh.client (web platform + inject edges), dsh.bundle manifest
├── cordis.patch.yml      # bundle patch: inserts the usage-stats config row into the profile
├── lib/
│   ├── index.js          # host plugin: UsageStatsService (Typert Remote)
│   ├── knowledge.js      # provider knowledge base: plan auto-detection (Code/Token)
│   ├── stats.js          # pure replay / aggregation / pricing logic (unit-testable)
│   ├── providers.js      # live quota/balance adapter facade (stable historical import surface)
│   ├── providers/        # adapter implementations (one file per vendor, sharing common.js)
│   │   ├── index.js      # registries: PROVIDER_USAGE (quota) / PROVIDER_BALANCE (balance)
│   │   ├── common.js     # shared helpers (request, auth, normalization)
│   │   ├── opencode.js           # OpenCode Go live quota (official endpoint)
│   │   ├── oauth-codex.js        # OpenAI Codex live quota (reverse-engineered)
│   │   ├── oauth-claude.js       # Claude Code live quota (reverse-engineered)
│   │   ├── oauth-copilot.js      # GitHub Copilot live quota (reverse-engineered)
│   │   ├── quota-zhipu.js        # ZhipuAI Coding Plan live quota (official endpoint)
│   │   ├── quota-minimax.js      # MiniMax Token Plan live quota (official endpoint)
│   │   ├── quota-clinepass.js    # ClinePass live quota (official endpoint)
│   │   ├── balance-deepseek.js   # DeepSeek account balance (official endpoint)
│   │   └── balance-moonshot.js   # Moonshot account balance (official endpoint)
│   └── client.js         # browser bundle (hand-written __ModuleLoader__ format)
├── docs/screenshots/     # UI screenshots
├── README.md             # Chinese readme
├── README.en.md          # this file
└── LICENSE               # MIT
Notes & limitations
- Statistics follow the harness token-meter projection semantics: only calls carrying provider usage are counted; reasoning is reported as an output subdivision when the log provides
reasoningTokens. - Billing is an estimate, not an invoice; cache reads are priced at the cache-hit rate.
- Sessions whose logs fail to decode are counted in
decodeErrorsand shown in the footer. - The Codex/Claude/Copilot quota endpoints are non-public / reverse-engineered and may change at any time; the adapters degrade gracefully (reason shown, fall back to local quota rows) and never crash.
License
Comments
Comments live in GitHub Discussions. Sign in with GitHub to post or react.