
Install
Inside DeepSeek Harness, with dsh-market
dsh plugin --profile web add dshmarket
Or from the command line
dsh plugin --profile web add dsh-cost-meter
Installing runs third-party code with your own permissions — it can read your files, use your credentials and reach the network. Review the source first, and pin a commit (github:owner/repo#sha) when you can.
README
English | 简体中文
Session cost tracking plugin for the DeepSeek Harness web GUI (bilingual UI)
Per-conversation cost · daily totals · OpenCode Go subscription quota display · budget with usage percentage · official account balance · custom provider balance · balance progress bar · history · peak/off-peak pricing hours display (peak hours UTC 01:00–04:00, 06:00–10:00; weekends and Chinese public holidays are off-peak all day, with separate labels) · pre-switch popup & system-notification alerts for peak/off-peak changes (position / lead time / alert type configurable) · one-click price sync from the official docs · Codex-style token usage heat grid · multi-vendor model pricing (built-in 90+ model price catalog with auto-matching) · mainstream Coding Plan quota queries & display (Anthropic / Z.ai / MiniMax / Kimi / OpenRouter / SiliconFlow / CommandCode / SCNet / Volcano Ark / Qwen / Xiaomi MiMo) plan/API dual-track billing (subscription quota vs pay-as-you-go money separated, per-1% & full-window token/equivalent-cost estimates with daily/weekly/monthly curves) · · quota strip above the input box (budget / Go / coding-plan usage in one row, toggleable)
v1.8.5 aligns statistics with DSH's native theme, adds full-selection step shares and expandable turn inputs/tool calls, and captures native-search usage when the fetch transport emits no Undici diagnostics. See the statistics guide and release notes.
Desktop users: follow the Desktop installation instructions for the application's own CLI and desktop Profile.
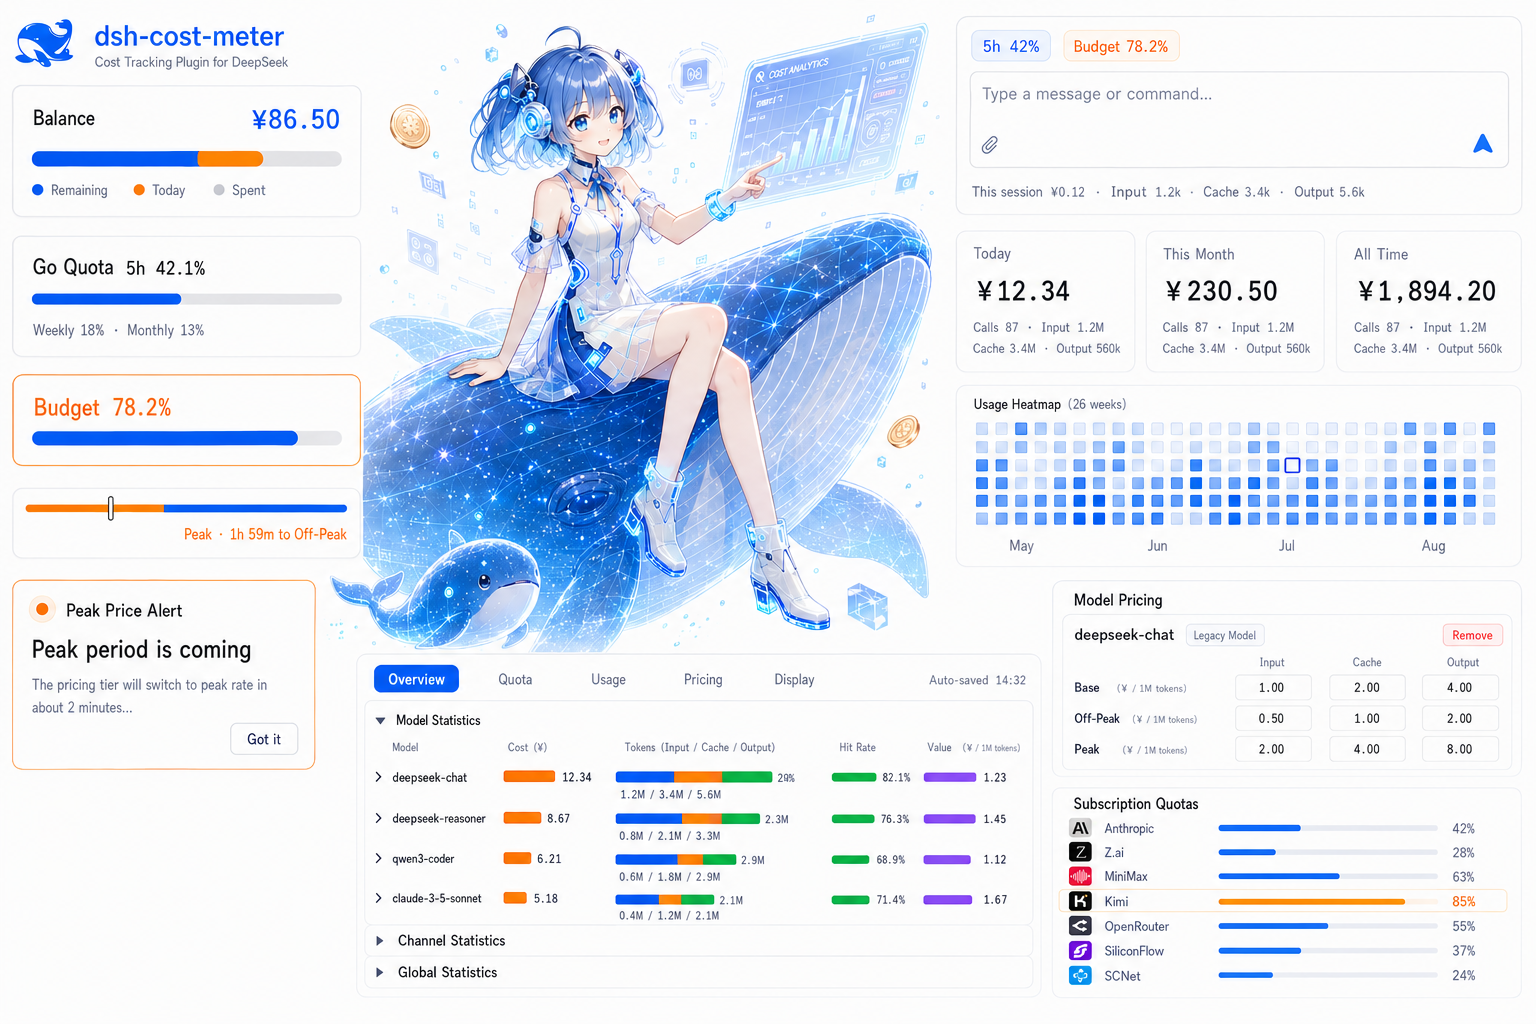
Feature overview
| Feature | Location | Description |
|---|---|---|
| Cost statistics | Below the conversation input / title bar / Settings → Cost → Cost statistics | Day, week, month, all retained and custom periods; API/Plan split, trends, model/conversation rankings and per-call costs. Guide; statistics requires DSH’s asynchronous module loader |
| Per-model cost card | Sidebar / composer dock (optional) | Disabled by default; inline Top-N, Other totals, shares and optional tokens, Today / Last 90 days, remembered expansion and a Top-1 chip. See the guide |
| Per-conversation cost | Below the composer / session title bar | Live accumulated cost + input/cache/output tokens; the composer footer shows cache hit rate before Input (cache reads / all input, including cache writes); position configurable |
| Official balance | Sidebar top / Settings page (configurable) | Total / granted / topped-up balance, auto-refresh + manual refresh; optional three-segment progress bar (blue/orange/gray), whose today segment only counts official-channel spend (coding plans / custom providers excluded) |
| Custom provider balance | Sidebar / Settings page (configurable) | Configurable HTTP balance lookup (e.g. LiteLLM); bilingual labels, currency, extract rules (dot path / number / add / subtract / divide — use divide for NewApi-style quota endpoints, see example); collapsible panel alongside Coding Plan quotas |
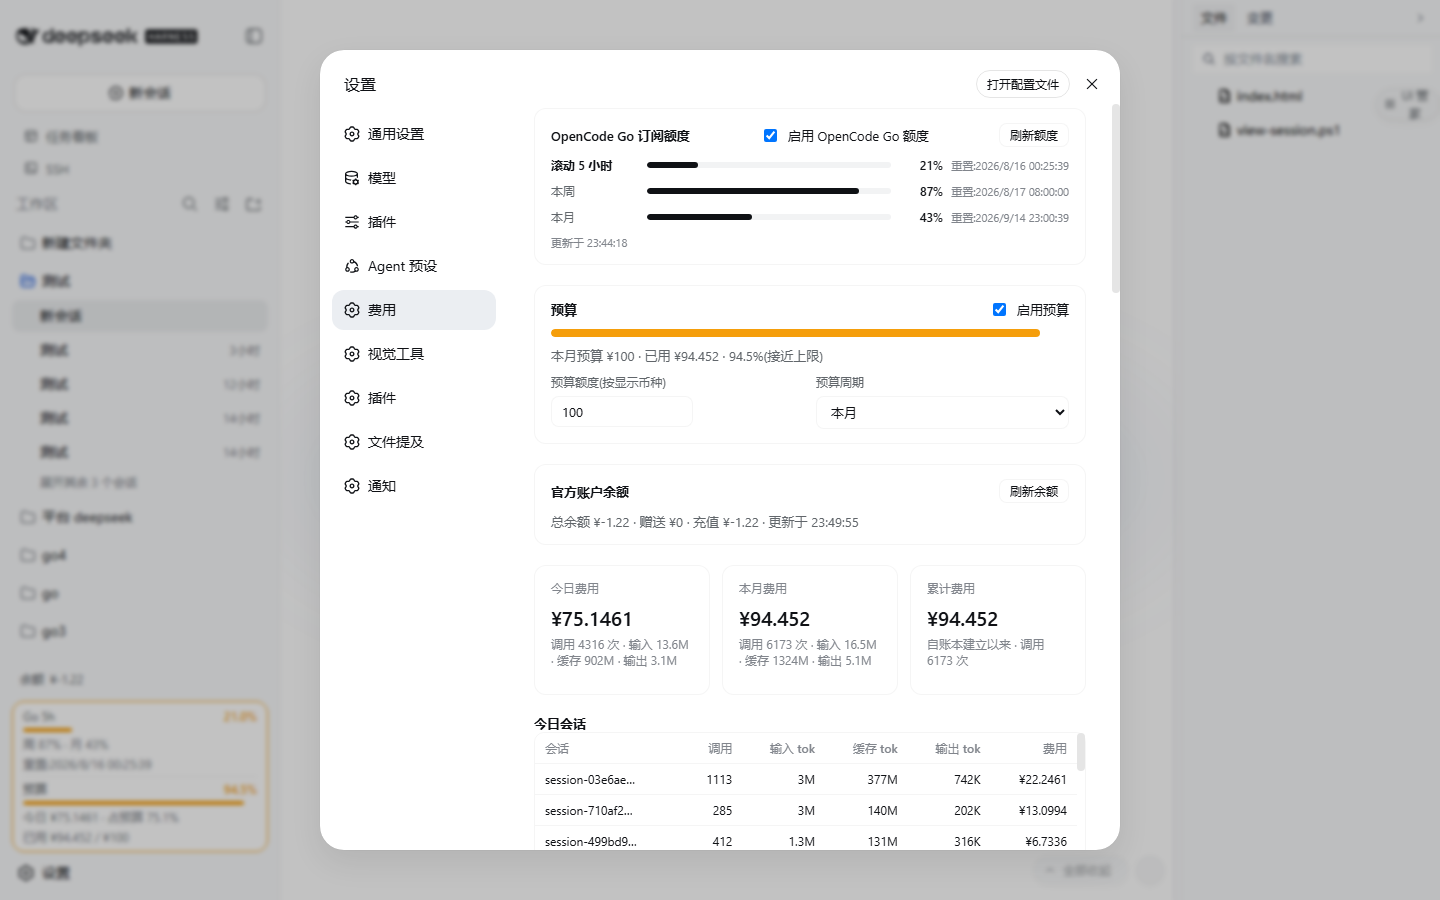
| OpenCode Go quota | Sidebar / Settings / bottom-right dock (configurable) | Rolling-5h / weekly / monthly usage percent and reset times, each window toggleable independently, budget used % can show alongside; key auto-discovered (dedicated ref / official Go route apiKeyEnv / env / opencode login) or entered manually |
| Coding plan quotas | Sidebar / Settings page (per vendor) | Multi-vendor coding-plan quota queries (Anthropic Claude Pro/Max, Z.ai / Zhipu GLM Coding Plan, MiniMax Token Plan, Kimi Code weekly + 5-hour quotas with PAYG balance fallback when no subscription key, OpenRouter credits, SiliconFlow balance, CommandCode 5h/weekly windows + monthly credits balance, Xiaomi MiMo Token Plan plan/compensation credit windows + period-end reset + balance via console cookie); per-vendor enable switch, key, display position and refresh interval (sidebar card in the same box style as the Go quota; the collapsed rail shows percentages), official endpoints by default, with a configurable trusted MiniMax origin; neutral hints when no credentials/subscription; SCNet Token Plan supports external console snapshots; without a valid snapshot, monthly usage is estimated from the local ledger via the official credits deduction table (no credentials needed) |
| Quota strip | Above the input box (toggle in Display settings) | One compact chip row for budget used % / the Go main window / each enabled coding-plan usage window (short label + mini progress bar, ≥80% warn, ≥100% over, hover for reset times); click any chip to refresh its data source (budget → state, Go → Go quota, vendor → all its windows); multiple windows of one vendor merge into a single segmented chip; a first-run guide card lets you decide whether to enable it; hides itself when there is no quota data |
| Click to refresh | Sidebar balance/quota boxes | Click the official balance / custom balance / coding-plan box (collapsed rail included) to fetch the latest data immediately; the box pulses while refreshing, failures keep the previous value and surface the reason in the hover tooltip; keyboard Enter/Space also triggers; a one-time guide card appears after the update |
| Simple sidebar display | Settings → Cost → Display | Optional, with a one-time choice after updating. Condenses cards and caps panel height at 38% of the viewport and 320 px, while preserving amounts, quotas, refresh actions and hover details. Turn off to restore your layout. Guide |
| Today's cost | Sidebar bottom (above the settings button) | “Today ¥x”, hover for call count and token details |
| Budget box | Sidebar bottom (between the balance row and the settings button) | Rounded-square frame: budget, used %, progress bar, today's cost & share of budget, used/limit; ≥80% warning, ≥100% over-budget |
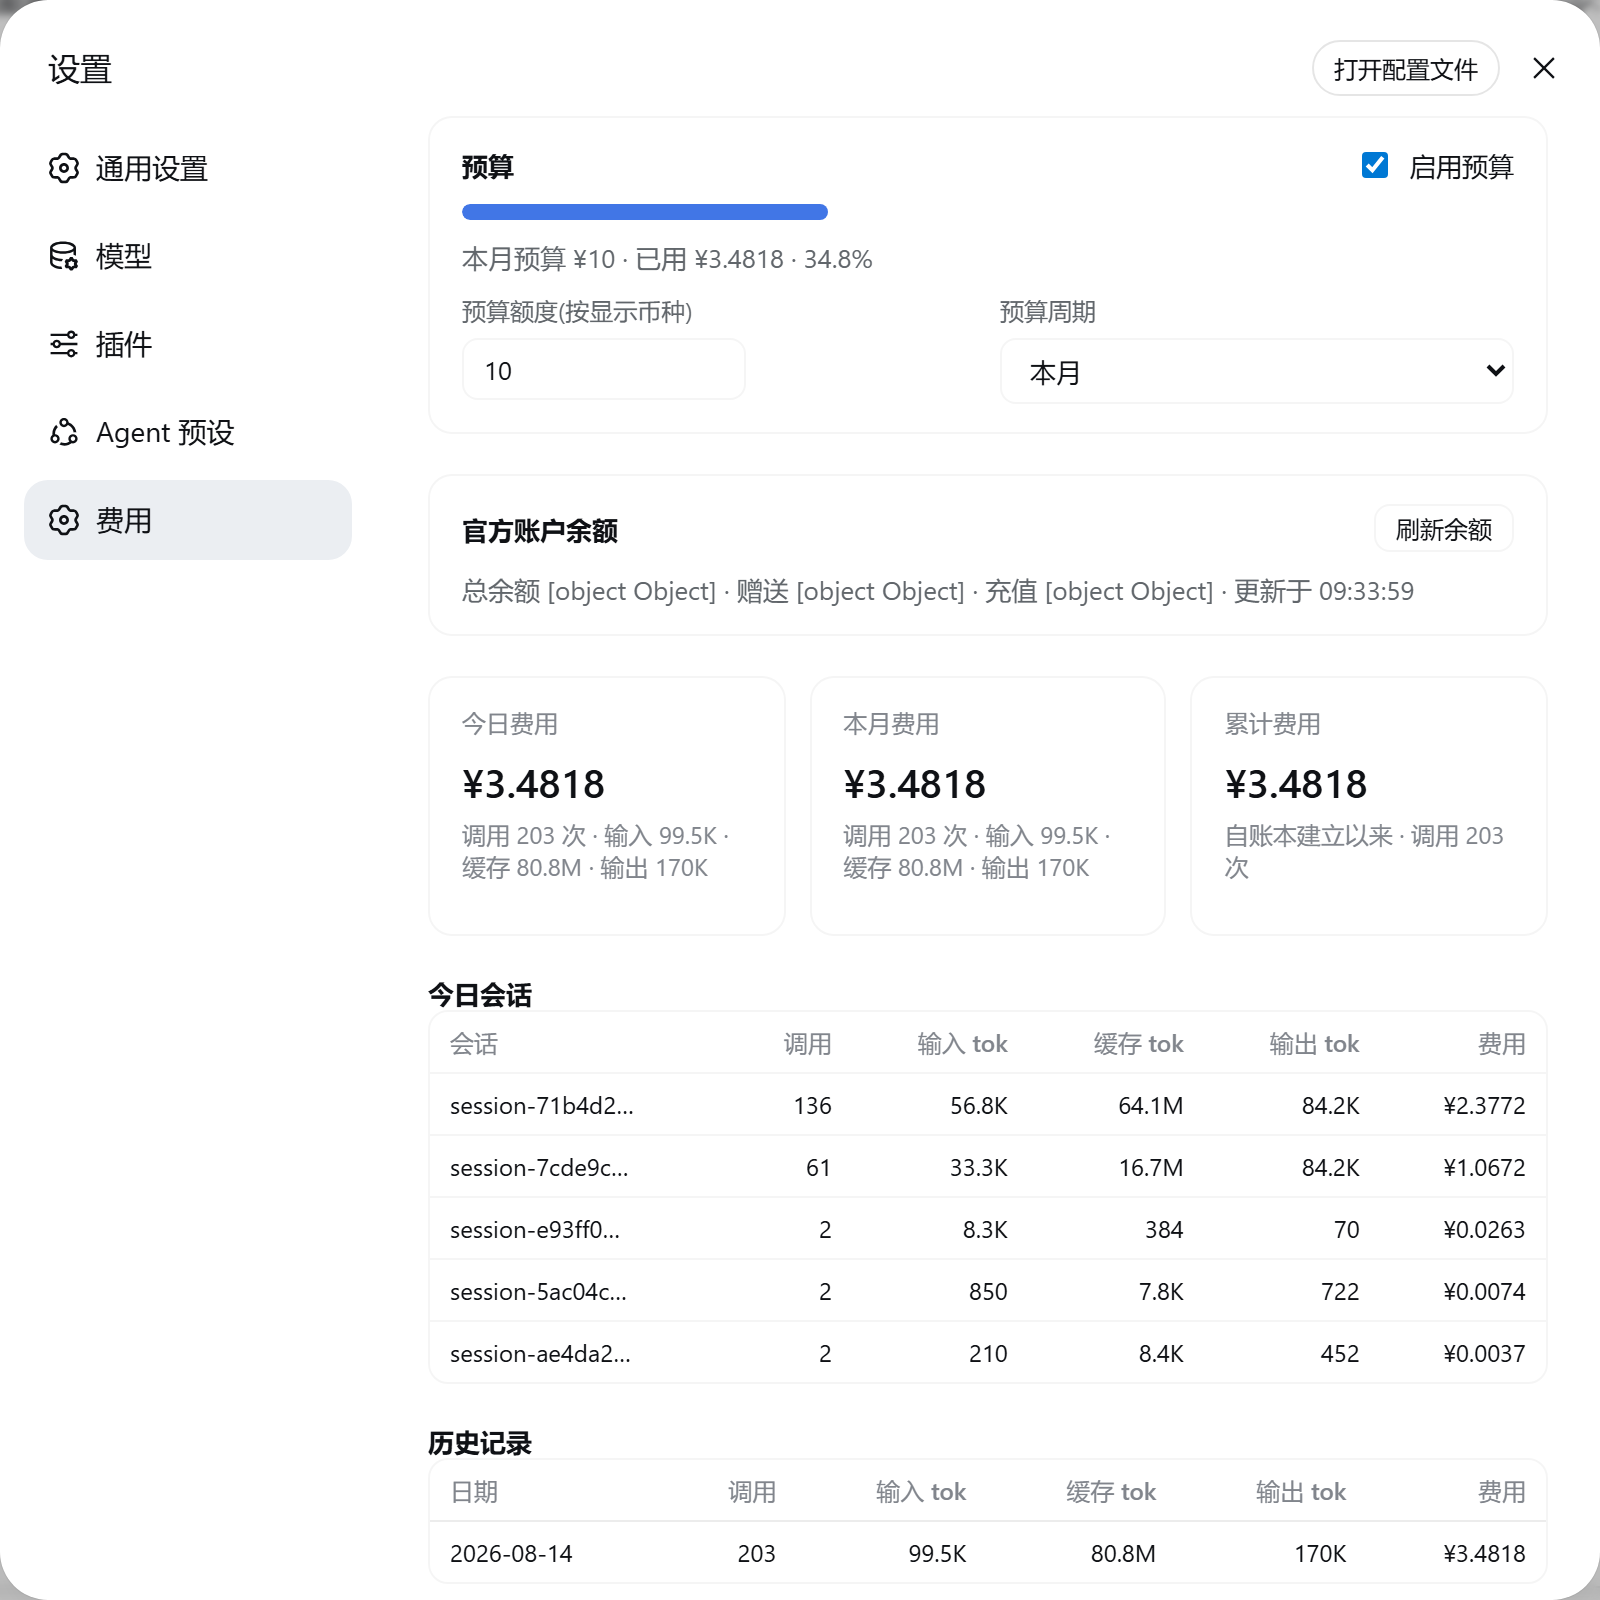
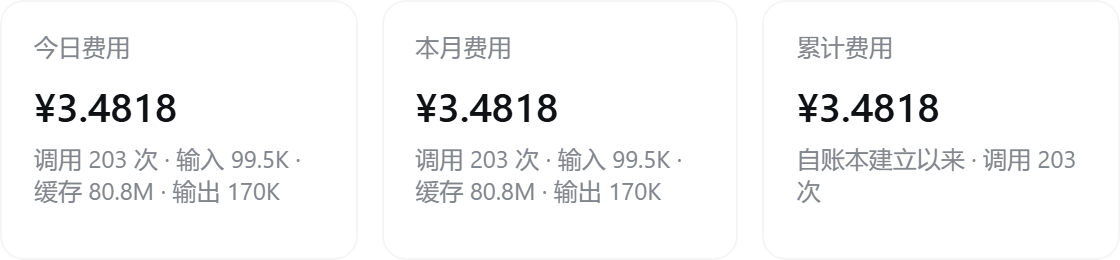
| Summary cards | Settings page | Today / this month / cumulative cost and call counts |
| External usage | Settings → Cost | Read-only snapshots from other processes on the same account; per-source tokens/calls/cost and recent days, plus DSH + external daily/monthly/all-time totals. Fresh external cost for today joins official balance reconciliation. |
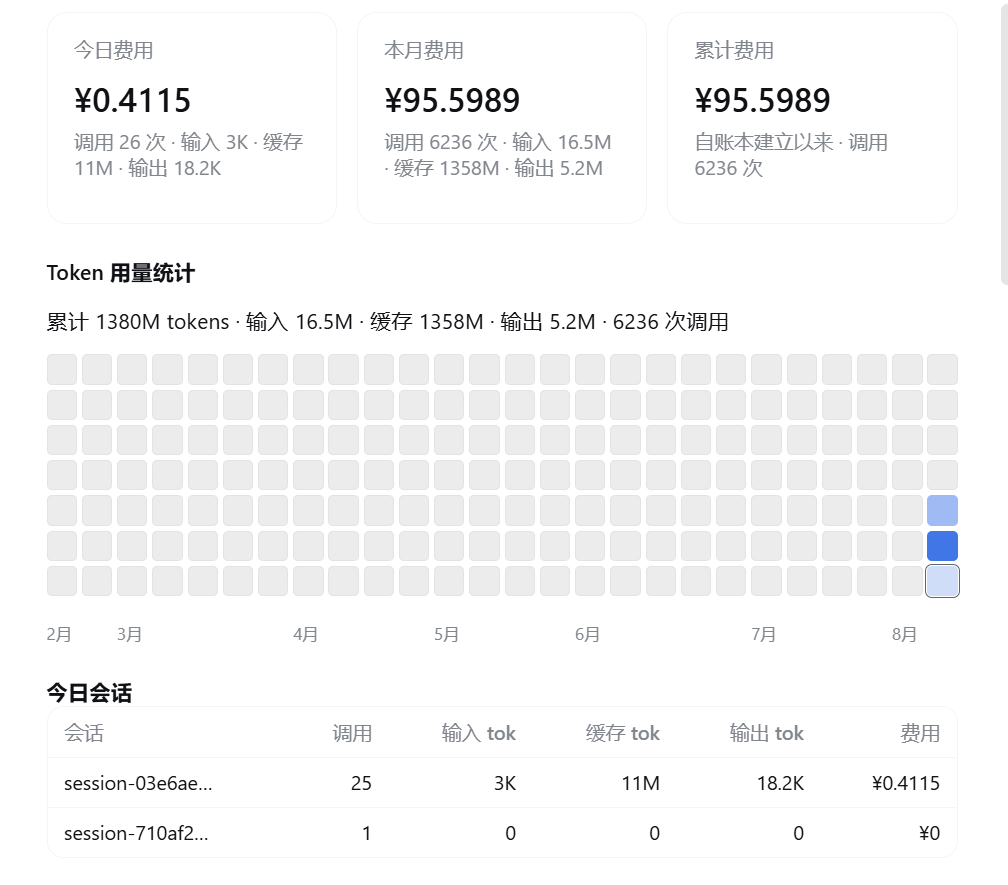
| Token usage stats | Settings page (Cost section) | All-time token totals (input/cache/output/calls) + a Codex-style 26-week daily usage heat grid that fills the settings width; hover a cell for that day's detail |
| Token Plan usage stats | Settings page (Usage) | Per enabled coding plan (incl. Go): per-1% quota and full-window token / equivalent-cost estimates for the current windows (sample delta / live ratio), plus daily/weekly/monthly usage curves; plan-channel amounts are equivalent-only and never touch real money (issue #64) |
| Today's sessions | Settings page | Per-session call count, input/cache/output tokens and cost |
| History | Settings page | Per-day totals; retention days configurable (default 180) |
| Pre-install history import | Automatic on first launch | After install/upgrade, the first launch automatically replays all host session logs to import conversations from before the plugin was installed (missing dates are rebuilt whole; existing dates only gain previously unknown sessions; idempotent and never double-counts live metering; costs priced at per-event historical rates); a manual re-run entry remains in Settings |
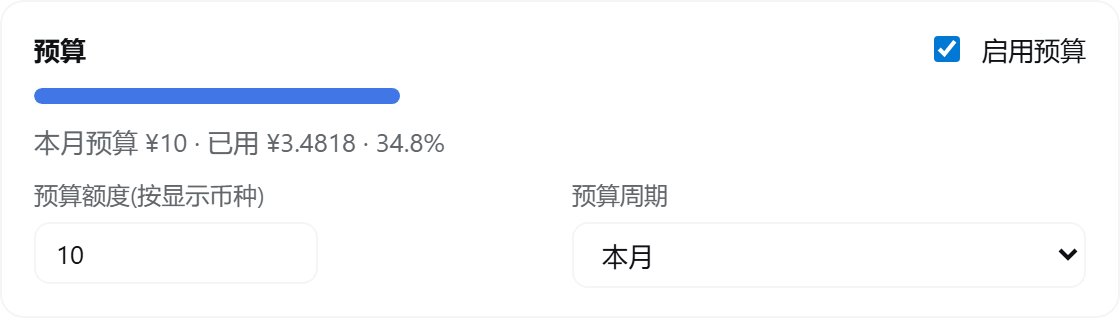
| Budget settings | Settings page, top | Limit, period (today / month / cumulative / custom date range), used % |
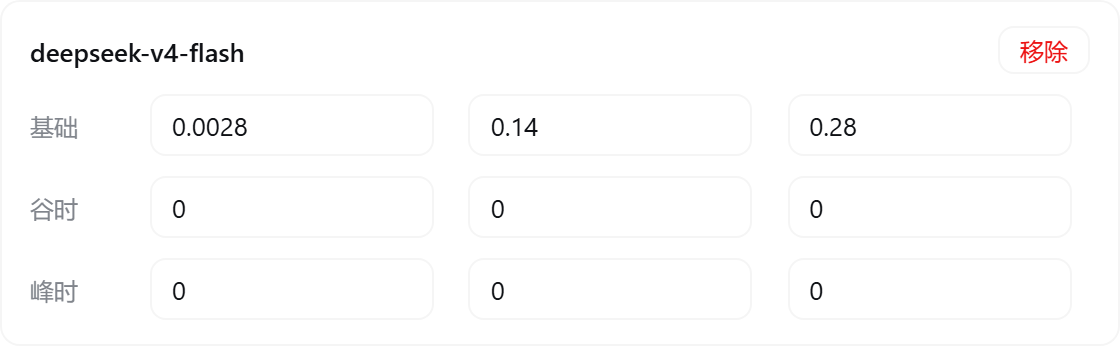
| Price table | Settings page | Per-model off-peak / peak prices (input/output shorthand supported; cache prices derived automatically); fully editable |
| Peak/off-peak hours display | Settings / budget / today | Shows UTC peak hours 01:00–04:00 and 06:00–10:00 with the current tier; weekends and configured Chinese public holidays (Beijing dates) are off-peak all day, with separate labels; expanded view shows a period strip and countdown, collapsed view shows a vertical bar; independently toggleable |
| Peak/off-peak switch popup alert | Global overlay | A full-width bracketed popup appears when the next tier switch is within the configured lead time (default 2 minutes, 1–30), with an alert-colored badge distinguishing entering peak vs off-peak; position selectable (bottom-right / screen center), alert type selectable (entering peak / entering off-peak / both), one alert per switch point; optionally sends a browser (system) notification (so you still get alerted when the page is backgrounded; requires granting notification permission); configured in the peak pricing panel in Settings, with a one-click popup preview (rendered by the real component — copy, position and notifications exactly as they will fire) |
| Official price sync | Settings page | Fetches and parses the official pricing page, applies with one click; the official price currency is selectable (USD · English page / CNY · Chinese page) — CNY prices are booked at the display exchange rate and match the official CNY bill when displayed in CNY |
| UI language | Settings → Display settings | Simplified Chinese / English / Follow browser (auto); switches instantly and auto-saves |
| Hide official balance / hide today's cost | Settings → Display settings | Two independent toggles: when on, the matching UI blocks (sidebar balance row & panels / today's cost row, budget details, overview today card) are not rendered at all; token and call-count stats stay visible — safe for screen sharing and screenshots |
| AI price sync | prompt | DeepSeek official sync; other providers use the verified official price catalog and manual configuration |
| Model & Plan adaptation guide | adaptation doc | Adaptation matrix for per-model billing and the Coding Plan vendors, the auto-matching mechanism and price sources (中文) |
| Peak/off-peak alert guide | alert doc | Fully illustrated guide to the pre-switch popup and system notification: effect screenshots (EN/中文), settings reference and usage tips (中文) |
| Token Plan usage stats guide | panel doc | Meaning of the four columns in the per-1% & full-window panel, the end-to-end delta estimation method and precision tags, the scope boundary (dsh-made calls only) and usage curves (中文) |
| OpenRouter passthrough pricing | pricing doc | Token reference prices: offline snapshot, scoped zero-cost backfill, public-catalog refresh, custom-price preservation and failure fallback (中文) |
| Multi-provider billing | Settings / ledger | OpenAI, Anthropic, Google Gemini, Mistral and other providers with input/output, cache and reasoning-token pricing isolated by provider + model |
| Model-name auto-matching | Settings / ledger | Unknown model ids are matched against the price table: case/spaces/hyphens/dots and bracket annotations (e.g. (go)) are ignored — a normalized-equal or containing name hits (e.g. gpt5.6 luna(go)); router providers (opencode/zen etc.) search across all vendors; can be restricted to exact match, and unmatched models can be pinned to a specific entry in Settings |
| Extended price catalog | Settings → Extended price catalog | Built-in reference catalog grouped by vendor and model family (expandable; vendors collapsed by default); mount entries into billing with one click — mounted third-party models live inside the catalog and stay editable; a per-model “Show directly in Cost settings” toggle chooses which models (DeepSeek included) appear directly in the price table |
Custom provider balance example (NewApi template)
POST with a JSON body: in Settings → Cost → Quota, expand a custom balance entry, select POST, then fill in Request body (JSON). For example, if the endpoint expects an account and returns {"data":{"balance":12.5}}:
{"account_id":"example-account","include_credit":true}
Set Extract rules (JSON) to {"remaining":"data.balance"}. Valid JSON is saved per entry and sent exactly as entered, including nested values and large integer IDs. Invalid JSON shows an error and keeps the last valid configuration; clearing the editor removes the body. GET/HEAD send no body while retaining it for a later switch back to POST. Content-Type: application/json is added automatically unless you supply a Content-Type header (any capitalization).
Existing request.body objects and raw strings remain supported. The body is ordinary saved configuration; {{VAR}} credential substitution applies only to request headers. For header authentication, use a reference such as {"Authorization":"Bearer {{MY_API_KEY}}"} and the credential input below it.
Display currency conversion: open Settings → Cost → Quota, expand a custom balance entry, and enable Convert USD balance to display currency. It defaults to off for each entry. Keep Source currency set to the endpoint's actual currency. With a USD balance of 54.3792, a CNY display rate of 7.2 and two decimal places, the balance displays as ¥391.53. Spend and API/manual limits convert together in the sidebar, settings and tooltips; progress percentages and stored balances do not change. Enter a manual limit in the source currency. The setting persists as convertToDisplayCurrency: true inside that customBalances[] entry (legacy customBalance is also supported).
The global exchange rate converts USD to the display currency. CNY/EUR source balances and Credits keep their original units; the switch is disabled for them. Alibaba Cloud balances use the currency returned by its API. No exchange-rate lookup or extra balance request is made when toggling this setting. Turning it off restores the original currency immediately.
DeepSeek CNY billing: USD prices × the display exchange rate and the official CNY table can give different amounts. Settings → Cost → Prices now explains this and provides a CNY selection button. See currency selection, sync and settlement timing.
For Qianwen / Alibaba Cloud fund accounts, use Add Qianwen / Alibaba Cloud balance to query available funds with a RAM AccessKey signature. The card uses the currency returned by the API. See the setup, permissions and balance definition.
Qwen Token Plan can use the official CLI subscription quota. Install the CLI on the DSH host and run qianwen auth login as the same OS user. Local estimates remain the default; CLI mode shows current account credits without changing the local ledger.
Local Qwen Token Plan credits include only the subscription providers qwen, qwen-tokenplan, qianwen-tokenplan, qwen-token-plan and qianwen-token-plan (case-insensitive, optional llm- prefix). Explicit API classifications are excluded. The qianwen pay-as-you-go provider does not consume estimated plan credits even when its model ID is identical. Use one of the supported subscription provider names; models outside the credits table need all three rates configured.
Xiaomi MiMo Token Plan quotas are queried with the MiMo console cookie, not an API key: log in at platform.xiaomimimo.com, press F12 → Network → find the balanceAlertConfig request and paste the full cookie request header into the MiMo card in Settings → Cost → Quotas (it must include serviceToken and userId; the DSH credential store keeps it as MIMO_COOKIE). The card shows the plan/compensation credit windows with the period-end reset (Beijing time) plus a balance row. Copy a fresh console cookie when the card reports an expired login. Token Plan inference keys (tp-* / ttp-*) are not accepted by this console adapter. Local plan statistics use the calendar month; compensation and balance are displayed without estimates because local calls cannot be attributed to those pools.
Each CLIProxyAPI source has a Gemini quota only option for its Antigravity groups. It defaults to off. Intentional filtering to no visible quota shows an empty list; malformed quota data still reports an error.
The extract rules accept four forms: a numeric constant, a dot path string, add/subtract over multiple paths, and divide scaling by a by divisor. divide fits NewApi and other endpoints that meter balance in integer quota (1 USD = 500000 quota — the same conversion cc-switch uses).
unit: "CREDITS": displays non-monetary credits using the configured decimal precision and a Credits suffix. Dollar spend is not converted to credits or shown as today's credit usage. Credit bars use the endpoint's credit cap; the global monetary budget does not apply.- Plain HTTP is allowed for loopback endpoints:
http://is accepted when the host is127.0.0.1/localhost/[::1](the traffic never leaves the machine), which covers local read-only routes that listen on loopback only and serve no TLS (e.g.dsh-workbuddy-connect's/plugins/dsh-workbuddy-connect/status). Every non-loopback host still requires https; plaintext is refused.
WorkBuddy credits example (local plugin route)
With dsh-workbuddy-connect installed, its web status route already returns the aggregated credit total — no credential needs to be copied:
{
  "enabled": true,
  "display": "sidebar",
  "refreshMinutes": 15,
  "label": "WorkBuddy 积分",
  "labelEn": "WorkBuddy Credits",
  "unit": "CREDITS",
  "request": { "url": "http://127.0.0.1:3080/plugins/dsh-workbuddy-connect/status", "method": "GET", "headers": {} },
  "extract": { "remaining": "credits.total" }
}
Adjust the port and response fields to the local service. This example requires the other plugin to expose that route. Cost-meter refuses redirects and continues to enforce configured credential host allowlists.
For NewApi GET /api/usage/token (response { "code": 200, "data": { "total_granted": ..., "total_used": ..., "total_available": ..., "unlimited_quota": false } }):
{
  "enabled": true,
  "display": "both",
  "refreshMinutes": 15,
  "label": "NewApi",
  "labelEn": "NewApi",
  "unit": "USD",
  "request": {
    "url": "https://your-newapi-host/api/usage/token",
    "method": "GET",
    "headers": { "Authorization": "Bearer {{NEWAPI_API_KEY}}" }
  },
  "extract": {
    "remaining": { "op": "divide", "path": "data.total_available", "by": 500000 },
    "maxBudget": { "op": "divide", "path": "data.total_granted", "by": 500000 },
    "spend": { "op": "divide", "path": "data.total_used", "by": 500000 },
    "unit": "USD"
  }
}
{{NEWAPI_API_KEY}}resolves from the DSH credential vault or an environment variable (placeholders work in headers only — the URL must be a literal address);- Unlimited-quota tokens (
unlimited_quota: true) have nototal_available, soremainingcannot be extracted and the query reports “remaining is missing or not numeric” — use a limited-quota token or a middle-layer endpoint that converts the units; - Entry point: Settings → Cost (Quota tab) → “Custom provider balance” → expand config; or write
config.customBalanceinstorages/cost-meter/ledger.json.
Credentials & security
- Variable naming:
{{VAR_NAME}}follows the<ROUTE>_API_KEYconvention —<ROUTE>is the Provider ID from the DSH Models page (Settings → Models), uppercased with non-alphanumeric characters replaced by underscores, e.g.openai→{{OPENAI_API_KEY}},anthropic→{{ANTHROPIC_API_KEY}},abc23-d→{{ABC23_D_API_KEY}}. Sharing a name with the Models page means the balance query and model calls share the same key (both resolve from the DSH credential store). This note is also shown above the “Headers (JSON)” input in Settings. - Credential input fields: after expanding an entry, the “Credential input” section renders one write-only field per
{{VAR}}placeholder found in the headers — the key goes straight into the DSH credential store (never written to disk, never echoed back, never stored inledger.json); no need to hand-edit environment variables or credential files. - Automatic plaintext migration: older versions let a literal
Bearer sk-…in the headers leak intoledger.jsonin plaintext. The plugin imports such keys into the DSH credential store at startup and replaces the header value with a{{CUSTOM_BALANCE_KEY_…}}placeholder (derived from the entry's host + header name, stable across restarts) — nothing breaks. From now onledger.jsonand the config shipped to the browser never contain plaintext keys: suspected secret headers (Authorization / X-Api-Key / Bearer / sk- prefixes / long opaque strings) are blanked, while placeholders and ordinary headers pass through. - Credential allowlist
allowedHosts: when headers carry credentials (placeholders or plaintext), the outbound host must be on this list or the request is refused — protection against leaked keys when importing someone else's config. Without a list, requests proceed with a one-time logged warning. The entry panel provides an “Allowed hosts” input (comma-separated). - Mixed credential templates: a header containing both a static secret and dynamic placeholders cannot be migrated as one nested credential. It is reported as pending and excluded from persisted/client config. Store the static part separately and use credential references throughout. Pure forms such as
Bearer {{VAR}}and{{USER}}:{{PASS}}remain supported.
CLIProxyAPI Gateway Quotas and WorkBuddy Credits (Issue #87)
Connects to a local or LAN-deployed CLIProxyAPI proxy gateway to observe quotas across upstream providers and WorkBuddy plugin credits in one place:
- Native Multi-Provider Discovery & Quotas: Auto-discovers active credentials via the CPA Management API and queries official native endpoints for Antigravity, Claude, Codex, Kimi, and xAI (Grok). Normalized into standard 5h / 7d / weekly / monthly usage percentage windows with ISO reset timestamps.
- WorkBuddy Plugin Credits: Queries WorkBuddy's read-only management route (
/v0/management/plugins/workbuddy/credits) to display total, used, and remaining credit balances alongside package lifecycle end-dates, preserving separate account cards. - Zero Metering Side-Effects Guarantee: Completely read-only — strictly avoids mutating actions such as Codex reset-credit consume, xAI token-consuming chat completion probes, and any WorkBuddy POST routes.
- Strict Credential Isolation & Transport Security:
- Management Keys are stored strictly write-only in the DSH credential store (
CLIPROXYAPI_MANAGEMENT_KEY_<SOURCE_ID>_<HASH>), never exposed in config, state, or browser views. - Management calls are strictly restricted to 3 fixed paths (
/v0/management/auth-files,/v0/management/api-call,/v0/management/plugins/workbuddy/credits). Arbitrary upstream URLs are forbidden. - Outbound host whitelist (
allowedHosts): Non-loopback origins require exact host matches, and plain HTTP requires an explicitallowInsecureHttpopt-in. - HTTP redirects are strictly forbidden (
redirect: 'manual'; any 3xx response is rejected) to guard against credential leakage or request hijacking. - Privacy and metadata sanitization: Strips raw tokens, cookies, and identity claims from auth-files discovery; emails are masked in public state (
s***@domain).
- Management Keys are stored strictly write-only in the DSH credential store (
Bilingual UI
The plugin UI (session badge, sidebar balance row & budget box, and the entire Settings page) supports Simplified Chinese and English:
- Language options: Simplified Chinese / English / Follow browser (auto);
- Default is “Follow browser”: the browser language is auto-detected (
zh*→ Chinese, otherwise English), and the detected value is written back into the config so server-side messages (balance query, price sync, etc.) match the UI language; - Switch it under Settings → Cost → Display settings → Language — the whole plugin UI updates instantly and auto-saves; the section label in the Settings sidebar switches too (费用 / Cost);
- Server-generated notices (balance refresh, official price sync, config validation errors, …) are also output in the current language.
Screenshots & walkthrough
All screenshots were captured on a live DeepSeek Harness instance. They show the Chinese UI by default; the plugin UI itself is bilingual (Simplified Chinese / English) — switch to English under Settings → Cost → Display settings → Language.
Main page
Sidebar bottom (top to bottom: official balance → quota/budget box → settings button):
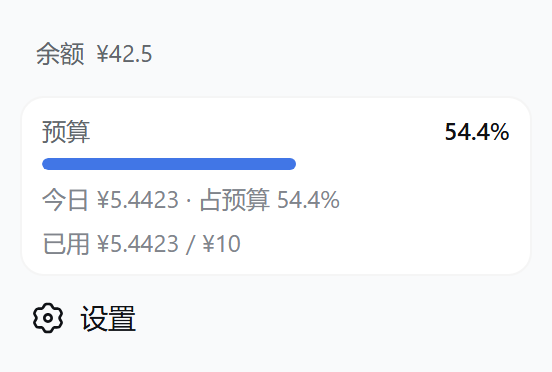
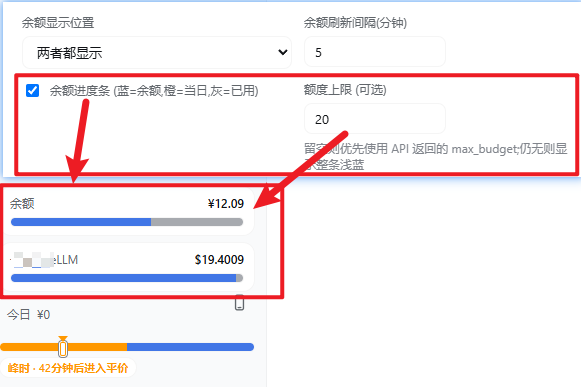
- The balance row shows the official open-platform total balance; hovering reveals the granted/topped-up split; with “Balance progress bar” enabled, both official and custom balances use the same three-segment box (blue = remaining, orange = today, gray = spent);
- With no budget enabled, that spot shows the “Today ¥x” badge.
Balance progress bar & custom provider settings:
| Sidebar progress bar + display settings | Custom provider balance panel |
|---|---|
 |
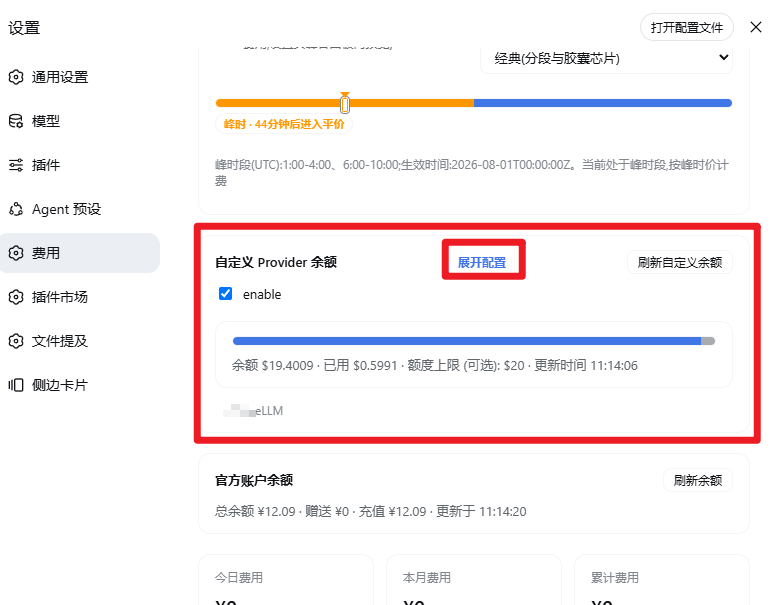 |
- Display settings → global “Balance progress bar” toggle; optional “Budget cap” overrides API
max_budget; - Settings → Cost → “Custom provider balance”: expand to edit URL / headers (JSON) / extract (JSON), bilingual names, and currency.
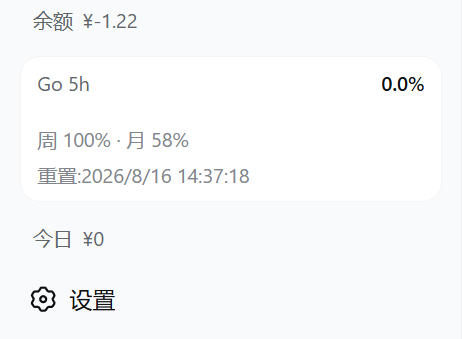
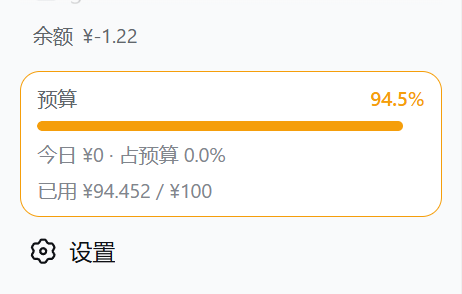
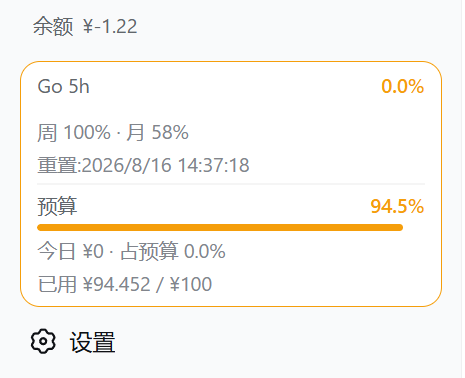
Quota / budget box — three states (OpenCode Go quota and the budget each toggle independently in the same rounded style; with both on they merge into one card — Go on top, budget below, thin divider, each keeps its own warning colors; the “box details” toggle collapses secondary rows to just label + used % + progress bar):
| Go quota only | Budget only | Merged |
|---|---|---|
 |
 |
 |
- The budget box shows “budget · used % · progress bar · today's cost & share of budget · used/limit”; ≥80% warning, ≥100% over-budget; rail mode narrows to a percentage tile;
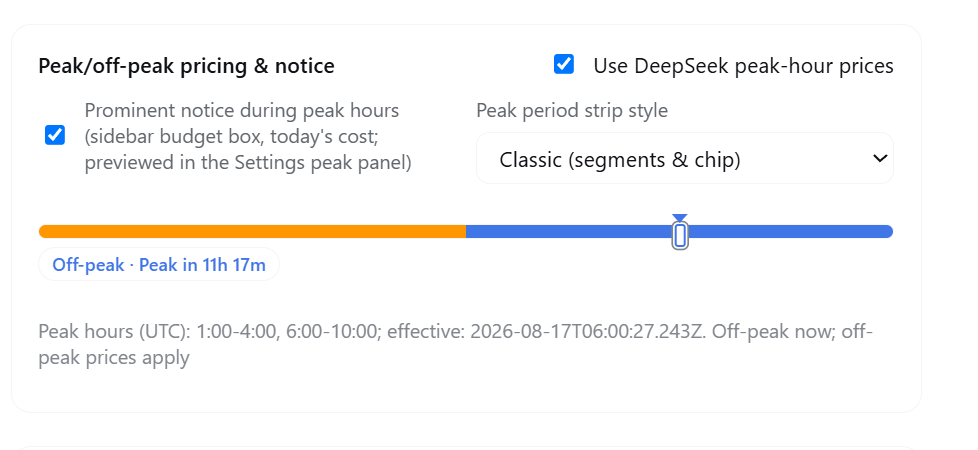
- The peak/off-peak hours display shows UTC peak hours 01:00–04:00 and 06:00–10:00 with the current tier; the budget box and today's cost area show a compact one-line period strip — a thin orange/blue track with a marker line on the current period, and text on the right showing the current period plus the countdown to the next switch (refreshed every 30 seconds); no prices are shown; it can be disabled independently in Settings, and the “Peak period strip style” option switches between the Compact and Classic looks; collapsed rail mode shows the same design vertically with a short horizontal label (“Peak / Off-peak”) below — the countdown and full text appear on hover;
Peak/off-peak period strip & collapsed vertical progress bar:
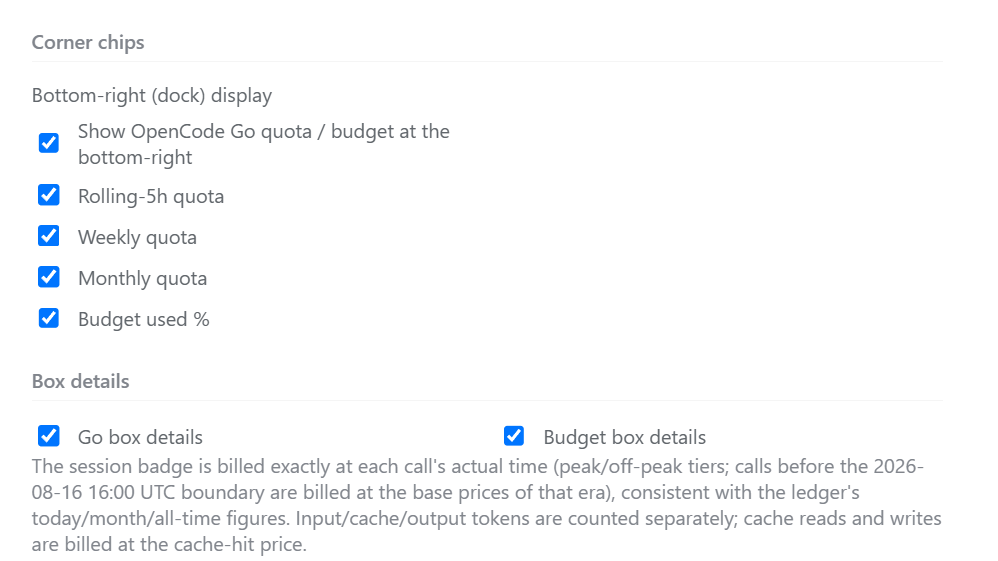
| Settings peak panel (notice toggle / style switch / preview) | Settings bottom-right (dock) display & box details |
|---|---|
 |
 |
Real captures from an actual DSH sidebar of the period strip and collapsed vertical bar (current looks), grouped by UI type (shown during peak hours):
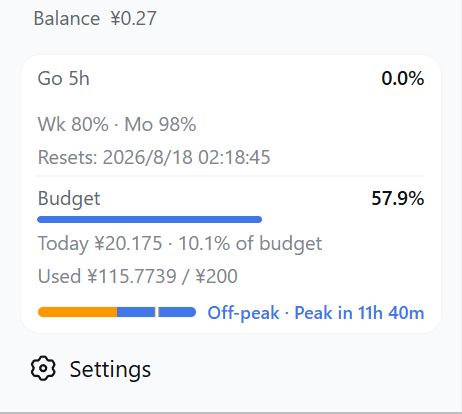
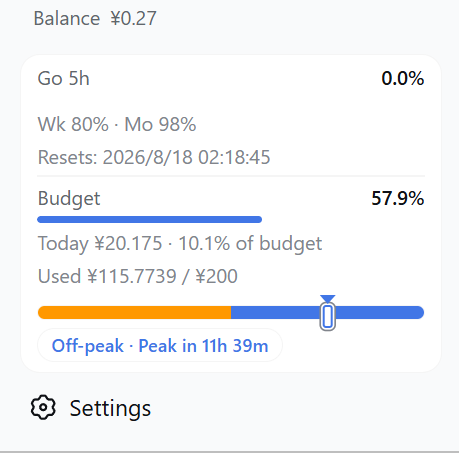
Expanded — the budget box / today's cost area shows a one-line period strip:
| Compact | Classic |
|---|---|
 |
 |
- Compact: thin orange/blue track with a marker line on the current period and a short caption, e.g. “Peak · Off-peak in 1h 40m”;
- Classic: same track and marker line with the full caption “Peak · Off-peak in HH:MM:SS” countdown (refreshed every 30 seconds); no prices are shown.
Collapsed (rail) — a vertical period bar stacked at the sidebar bottom, centered with the percentage squares:
| Compact | Classic |
|---|---|
 |
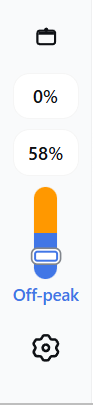 |
Compact: only the short horizontal label (“Peak / Off-peak”) below the vertical bar;
Classic: the full caption stacked vertically below the bar, including the countdown to the next switch; in both styles the full text is also available on hover.
The display follows the
peakNotice/peakEnabled/peakEffectiveAt/peakWindowsgates and uses the configured UTC peak windows;Settings → Cost → Peak/off-peak pricing includes an independent “Prominent notice during peak hours” toggle; turning it off hides both the expanded strip and the collapsed vertical bar;
The first image above is the Settings peak panel (notice toggle, style switch and live preview); see the grouped captures for the strip and collapsed vertical bar; the dock toggles and box-details switches are shown in the second image.
The Go box shows the main window's used % and progress bar (default rolling 5h; switchable to weekly/monthly in Display settings), with the other two windows and reset times in a row below:
Bottom-right (dock) quota / budget chips (enabled in Display settings; four independent toggles: 5h / weekly / monthly quota + budget used %):
| Corner chips in action | Display settings (where the toggles live) |
|---|---|
 |
|
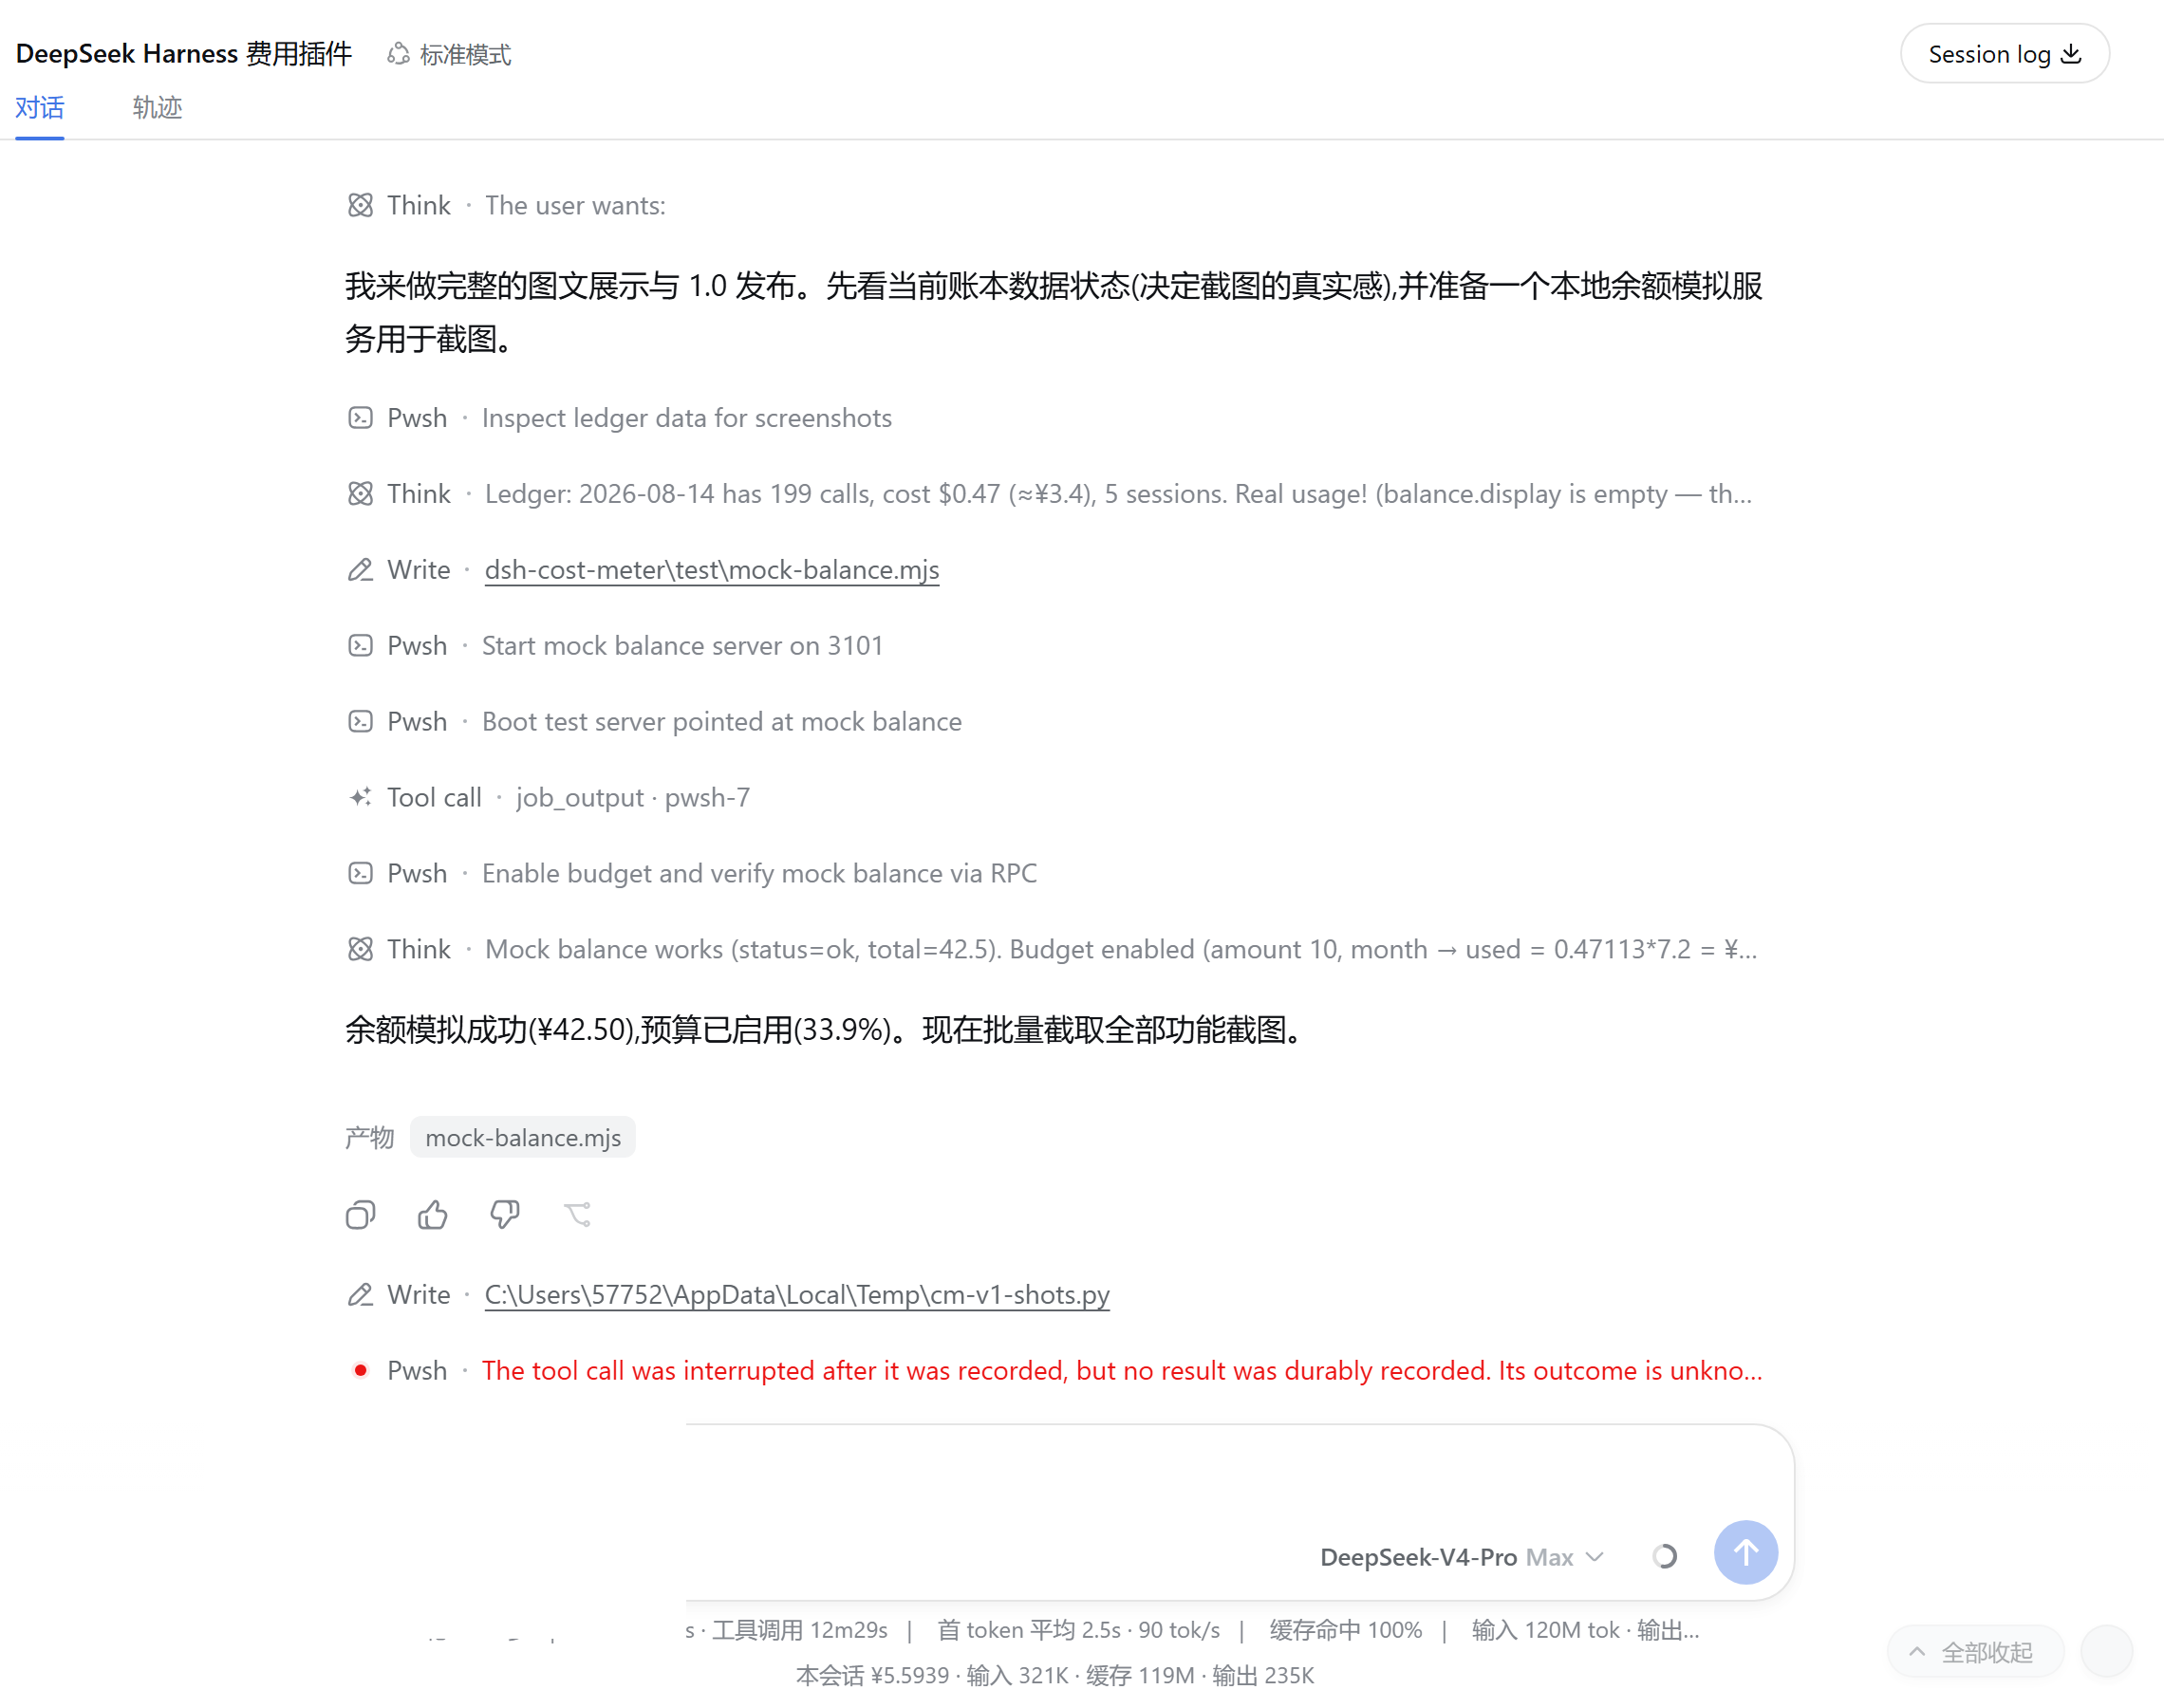
Per-conversation cost (two positions, switchable in Settings):
| Below the composer | Session title bar |
|---|---|
 |
 |
Left: this session ¥5.5939 · input 321K · cache 119M · output 235K; right: title-bar badge “cost ¥6.1606” (real session captures)
Settings → Cost
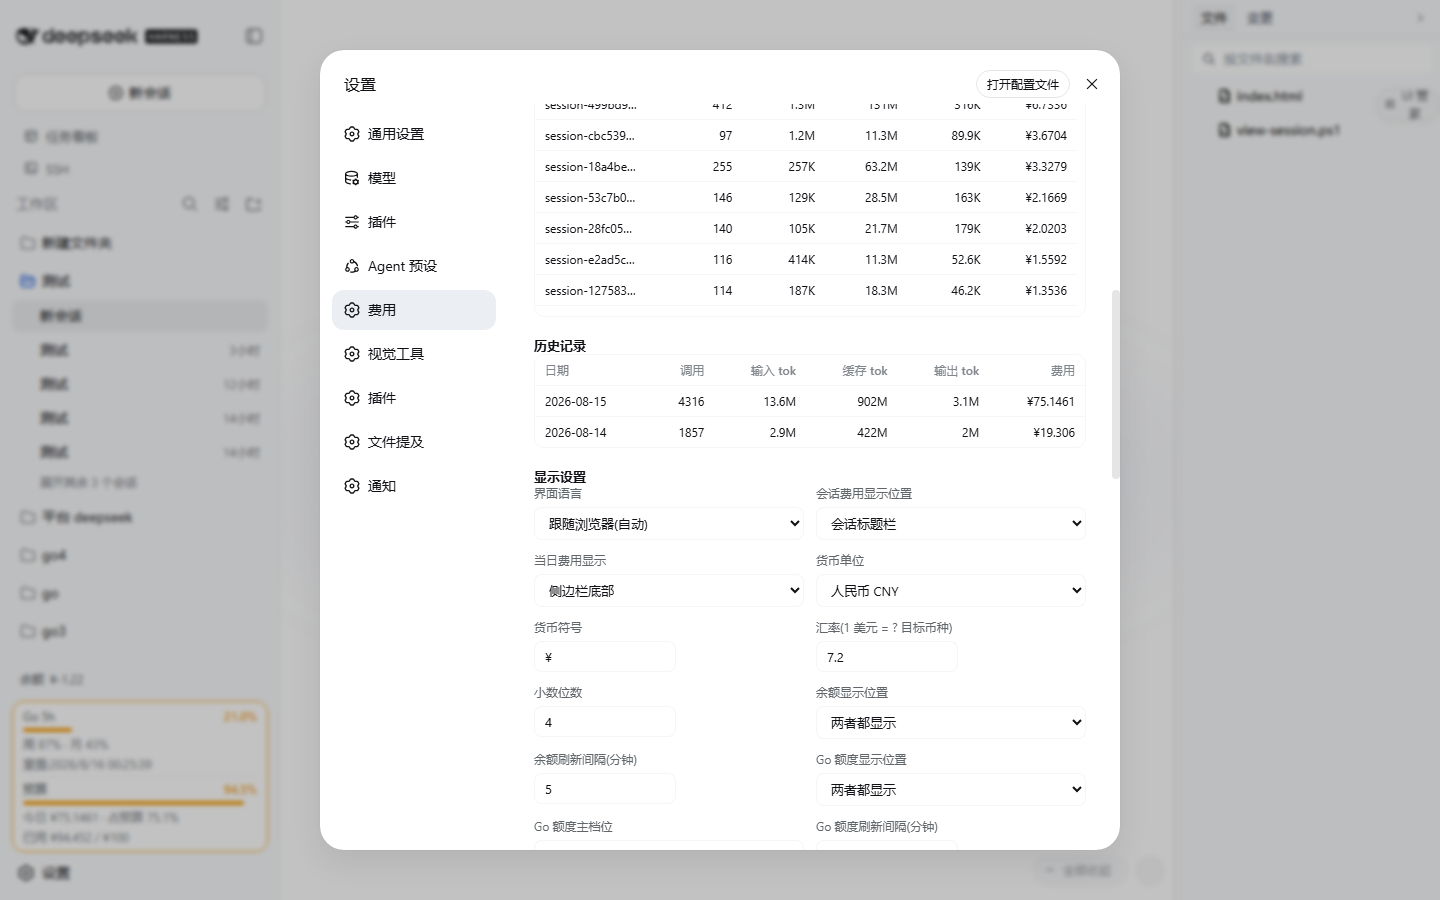
Overview (OpenCode Go quota → budget → balance → summary cards → today's sessions → history → display settings → price table → data & sync):
OpenCode Go quota panel (very top of the Settings page: three progress bars, main window highlighted, manual refresh; a neutral hint when there is no subscription, one-click disable):
Budget panel (including custom date ranges):
Balance panel (total/granted/topped-up + manual refresh):

Display settings (Go main window & key, corner chips, box details, …):
Summary cards:
Token usage stats (all-time totals + a Codex-style 26-week heat grid filling the settings width; translucent glass cells for unused days):
Today's sessions / history (input, cache and output tokens in separate columns):
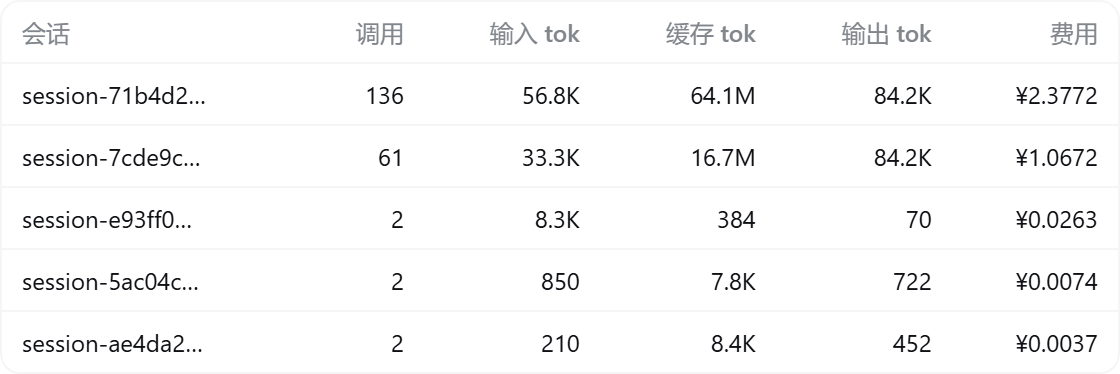

Price table (off-peak / peak tiers, with input/output shorthand support, USD / 1M tokens):
Data & sync (instant auto-save of settings + official price sync + clear history):

Installation
Requirements: Node.js ≥ 20 + DeepSeek Harness (a version with the
dsh plugincommand;npm install -g @deepseek-ai/dsh) + pnpm on the DSH process's PATH, including npm-name installs and Plugin Hub installs. Node.js ≥ 22.13 is recommended for the pinned pnpm 11 below; Node.js 20 users can use pnpm 10.
One-click install (recommended)
First-time setup on macOS / Linux: install pnpm in the terminal you use to start DSH (the same commands also work on Windows):
npm install -g pnpm@11.21.0
pnpm --version
On Node.js 20, use npm install -g pnpm@10 instead. See pnpm installation and supported Node.js versions.
npm package name (published to the npm registry, always tracks the latest version; no git needed):
dsh plugin --profile web add dsh-cost-meter
PowerShell one-click script (copy the whole line, paste, press Enter; pnpm is provisioned automatically, git is auto-detected — no clone needed; the install chain is pinned to the release tag v1.8.5 — review the script before running):
irm https://raw.githubusercontent.com/Han-1413141/dsh-cost-meter/v1.8.5/install.ps1 | iex
Or a plain command line (the machine must already have pnpm and git; also pinned to the tag):
dsh plugin --profile web add github:Han-1413141/dsh-cost-meter#v1.8.5
Without git, use the GitHub tag archive:
dsh plugin --profile web add https://github.com/Han-1413141/dsh-cost-meter/archive/refs/tags/v1.8.5.tar.gz
After installing, restart dsh web (plugin rows, the Typert manifest and the client bundle are all scanned at startup):
dsh web
Install troubleshooting: pnpm was not found (macOS / Linux)
dsh: pnpm was not found; install pnpm and make it available on PATH. means DSH cannot start its package manager; the plugin has not loaded yet. Installing by npm package name still requires pnpm.
After the setup above, check the commands from the same terminal and OS user that start DSH:
command -v node
command -v pnpm
command -v dsh
If npm installed pnpm but the shell cannot find it, add npm's global executable directory for the current shell, then retry:
export PATH="$(npm prefix -g)/bin:$PATH"
pnpm --version
dsh plugin --profile web add dsh-cost-meter@latest
dsh web
Stop the existing DSH process before restarting it. Plugin Hub runs inside DSH and inherits that process's PATH; reopening the browser alone will not refresh it. With nvm/fnm, select the Node.js version used by DSH before installing pnpm. If npm reports EACCES, use a user-owned Node.js installation/global prefix as described in the pnpm guide, then repeat the PATH check. For a persistent shell setup, add the executable directory to your shell profile. A successful install on your machine is confirmed by the plugin appearing after DSH restarts.
Install troubleshooting: ERR_PNPM_MINIMUM_RELEASE_AGE_VIOLATION
Symptom: dsh plugin --profile web add fails with [ERR_PNPM_MINIMUM_RELEASE_AGE_VIOLATION] N lockfile entries failed verification.
Cause: your environment (pnpm config or a policy bundled into the invoking installer) enforces the "minimum release age" supply-chain protection — any lockfile entry published more recently than the threshold is rejected. Plugin releases from before runtime dependencies were exact-pinned declared floating ranges, so a fresh install resolved them to whatever was newest at that moment (^0.1.0-rc.6 was observed to float onto rc.8 published barely a week earlier), which such a policy refuses.
Fix:
- Upgrade the plugin and use the host's plugin installer:
zodremains exact-pinned.@deepseek-ai/dsh-credentialsand@deepseek-ai/dsh-home-pathsare now peer dependencies supplied by DSH, avoiding duplicate old host packages that can fail dependency preflight (issue #106). Pinning prevents version drift but cannot satisfy every age threshold; - If an age restriction remains, wait until the version reaches the threshold, or review the exact package and version in the error before choosing to add an individual exclusion to the profile's
pnpm-workspace.yaml(default$DSH_HOME/profiles/web/pnpm-workspace.yaml):
minimumReleaseAgeExclude:
  - '<name@version from the error>'
DSH 0.2.0-rc.1 passes packed installation, Web startup, shared-module checks, synthetic billing, RPC and the full regression suite. Earlier host checks cover installation, startup, shared modules and removal on DSH 0.1.2-rc.1, 0.1.3-alpha.2 and 0.1.5-alpha.1. 0.1.3-alpha.1 remains unknown because its official npm version was unavailable during the earlier check. See the compatibility record for the environment and limits.
If Plugin Hub reports only diagnostics: .../.plugin-manager/logs/operation-.../pnpm.log, that line does not identify the failed package or command. Open the named pnpm.log and include the first actual error when reporting the failure; remove credentials and private paths before sharing it. Git URL and npm-name installation on DSH 0.2.0-rc.1 are covered by isolated Windows checks, but an individual machine's failure still requires its diagnostic log.
Balance HTTP 401 in account-login mode: configure a dedicated Open Platform API key under Settings → Cost → Account balance. See credential priority and storage.
Update / Uninstall
# update: re-run the new release's install.ps1 (the pinned tag inside it moves with the release)
dsh plugin --profile web remove dsh-cost-meter  # uninstall
Installation errors and plugins still disabled after reinstall: see troubleshooting.
Local development
git clone https://github.com/Han-1413141/dsh-cost-meter.git
cd <parent directory of the clone>
dsh plugin --profile web add link:./dsh-cost-meter  # symlink; edit lib/client.js, refresh the page, done
Billing rules
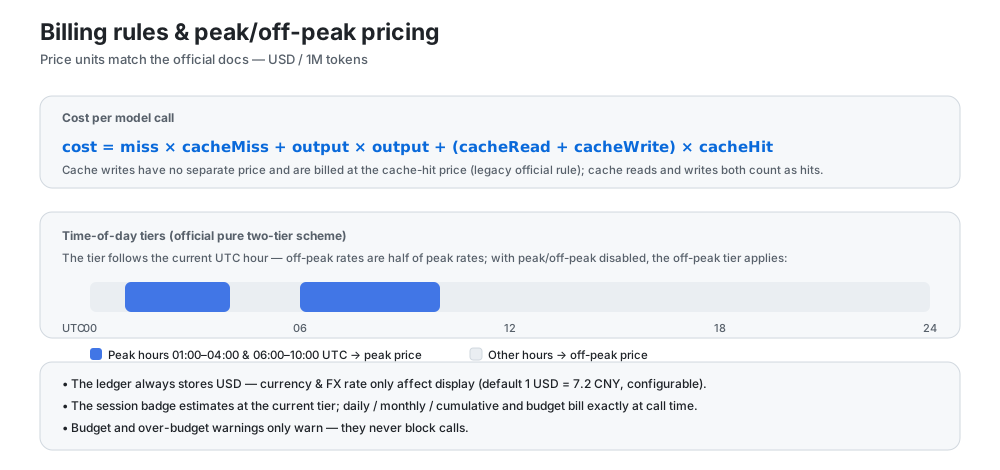
- Price units match the official docs: USD / 1M tokens;
- cost = cache-missed input × cache-miss + output × output + (cache read + cache write) × cache-hit (cache writes follow the legacy official rule and are billed at the hit price);
- Pure two-tier peak/off-peak pricing (the official scheme since 2026-08): peak hours (01:00–04:00, 06:00–10:00 UTC) bill at the peak price and all other hours at the off-peak price (off-peak = half of peak). The base tier equals the off-peak tier, and billing falls back to off-peak when peak/off-peak is disabled; the Settings page shows the live tier (peak / off-peak); the budget/today's cost area shows a peak/off-peak period strip (current/next period with countdown), and the collapsed rail shows a vertical peak/off-peak progress bar;
- Weekends and Chinese public holidays: weekends are off-peak all day from 2026-08-23 00:00 Beijing time, including work-shift weekends. Chinese public holidays are also off-peak all day.
peakHolidayscontains Beijing dates inYYYY-MM-DDformat and defaults to the published 2026 Mid-Autumn and National Day dates after the peak-pricing change; edit the list in Settings → Cost → Peak pricing for future holidays. The period strip labels holidays separately and counts down to the next actual price change. Historical DeepSeek costs are recalculated once from complete session logs; rows without complete logs keep their recorded amounts; - Historical billing correctness: calls before 2026-08-16 16:00 UTC (the peak-era boundary) are billed at the base prices of that time, and later calls at the two-tier scheme;
- The ledger always stores amounts in USD; currency and FX rate only affect display (default 1 USD = 7.2 CNY, configurable);
- The session badge is billed exactly at the moment each call is made (host-exported per-call cost), just like daily/monthly/cumulative totals and the budget;
- Billing uses usage blocks reported through the host's
llm/stream, including sub-agents, compression, title generation and other auxiliary calls in isolated LLM services. Child sessions retain their ownsessionIdand do not contribute to the parent badge; background calls without asessionIdcontribute only to daily/monthly/lifetime totals. Memory or other plugins that call external APIs directly without reporting usage to the host cannot be tracked; - Peak/off-peak tiers follow the request-initiation moment: a streaming call can span the tier boundary hour; attributing by completion time would put a request started minutes earlier into the wrong tier;
- Peak effective-time anchoring: the official pricing page no longer lists an effective time, and price sync no longer resets the peak effective moment to "now" — historical recomputes (session projection refolds / per-model backfill) always tier events against the 2026-08-16 16:00 UTC boundary, so peak-hour history is no longer re-costed at half price; ledgers polluted earlier are clamped back automatically on upgrade (idempotent migration);
- Switching pricing currency re-bases the whole history: after the pricing-currency setting flips and re-syncs, historical entries are re-costed on the new price table in the background (days fully covered by session logs are replaced wholesale; sessions whose logs were cleaned keep their original basis), so history and the official bill share one basis, with a notice on completion; on upgrading to this version, existing ledgers that had switched currency and ended up with mixed bases are recomputed once automatically;
- Aligning with official bills: ① minute-level lag vs live official numbers is expected — the ledger flushes on a 2s debounce, and streams still in flight at shutdown are billed server-side while their usage block is never received (the gap concentrates in cache-hit columns); ② reasoning tokens are reported separately by the API and are not billed — the token columns sum five buckets and will never line up with the official three columns, so reconcile by amount; ③ with pricing currency set to CNY, entries are recorded directly on the official CNY price list (recommended for CNY-billed accounts); with USD, displayed amounts go through a fixed FX rate and carry a small structural difference (the two lists' per-column ratios are not uniform);
- Budget and over-budget warnings only warn — they never block calls.
- Plan/API dual-track billing (issue #64): calls on subscription-style channels (MiniMax, manually-marked Codex, etc.) are recorded as catalog-price equivalents only; budget/today-cost/overview cards count the pay-as-you-go (API) channel exclusively.
- Full-repo security audit fixes: resolved 3 high-risk findings — ledger writes lost on exit (close/flush ordering), command injection in the release script, panel null-pointer crash on null Go monthly window — plus 30+ medium/low issues including missing hour-bucket entries for routed calls, dead balance-reconciliation warnings, failed custom-balance extraction silently showing $0, and leaked upstream streams on consumer abort; ledger corruption auto-backup, write-failure retry, config-patch atomicity and prototype-chain hardening included. Itemized list: CHANGELOG.md.
- "Include plan totals" toggle under the overview cards switches every amount between real-money (API channels only, default) and total equivalent cost (plan subscriptions included); routed calls with a missing provider whose models match third-party catalogs are auto-classified into the matching plan, and legacy per-day residuals without model details count toward the API scope; The Token Plan stats panel in Settings → Usage provides per-1% and full-window token/equivalent-cost estimates plus daily/weekly/monthly usage curves; classification is configurable per vendor and per provider:model.
Data storage
- Ledger:
$DSH_HOME/storages/cost-meter/ledger.json(atomic write + 2-second debounce; retained perhistoryDays, up to 200 per-session entries per day); - API keys never touch disk: all credentials (OpenCode Go key, coding-plan keys, Volcano AK/SK) live only in the DSH credential store — neither the ledger file nor anything sent back to the settings page contains plaintext; the settings inputs are write-only and never echo a saved key back;
- Every settings change is saved instantly and automatically (600 ms debounce) — no manual save needed;
- Delete the ledger file to reset everything, or use “Clear all history” in Settings;
- Privacy boundary: balance/quota endpoints (official balance and each coding plan) only get contacted after you explicitly enable the corresponding provider — no network traffic for disabled ones.
Architecture
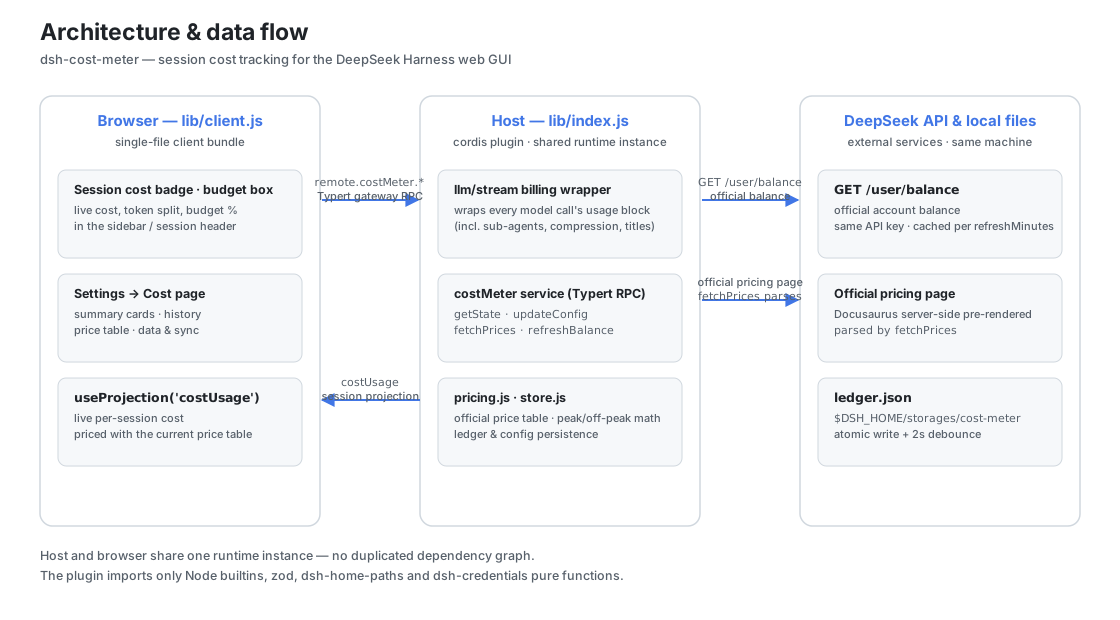
dsh-cost-meter
├── cordis.patch.yml        # bundle patch: inserts the cost-meter row into the web profile
├── install.ps1             # one-click install/update script (irm … | iex)
├── .github/workflows/      # CI: install-smoke for the one-click install path
├── package.json            # dsh.bundle patch declaration + dsh.client browser declaration
└── lib/
    ├── index.js            # host plugin: llm/stream billing wrapper, costUsage session
    │                       #   projection, costMeter service (hand-written typertRemote
    │                       #   binding), balance lookup
    ├── pricing.js          # official price table, official page HTML parsing, peak/off-peak math
    ├── store.js            # ledger persistence & config management ($DSH_HOME/storages/cost-meter)
    ├── typert.host.js      # ./typert export: Typert manifest (auto-registered by typert-loader)
    └── client.js           # ./client export: browser single-file bundle (badges/box/settings)
Data channels:
- Per-conversation cost: the host registers the
costUsagesession projection (pure token buckets, split per model); the browser reads it viauseProjection('costUsage')and prices it with the current price table; - Global ledger / budget / balance / config:
costMeter/getState | updateConfig | fetchPrices | refreshBalance | resetHistoryover the Typert gateway RPC (remote.costMeter.*); - Balance: calls the official
GET {baseURL}/user/balance, reusing the same API key as model requests (credential service / env var), with an in-process cache expiring perrefreshMinutes.
The plugin never imports cordis/dsh Service/Context runtime classes (only Node builtins, zod, and pure functions from dsh-home-paths and dsh-credentials), so it shares one runtime instance with the host with no duplicated dependency risk.
How official price sync works
fetchPrices fetches the official pricing page (Docusaurus server-side pre-rendered; the English page lists USD prices and the Chinese page CNY prices, selected by the "official price currency" setting — currency is auto-detected from the money symbols, and peak windows on the Chinese page are converted from Beijing time to UTC by −8h) and parses:
- the base price table (transposed layout: first row MODEL + model ids, price labels followed by the prices);
- the peak/off-peak price table (two rows per model: OFF-PEAK / PEAK);
- the effective time (“take effect at …”) and the peak-hour windows (“Peak hours are …”).
The parsed result is written into the price table and persisted; if the page structure changes, sync reports an error and keeps the previous prices, with manual editing as a fallback.
AI price sync
docs/AI-PRICE-SYNC-PROMPT.en.md (English) and docs/AI-PRICE-SYNC-PROMPT.md (中文) provide prompts you can copy straight into any AI: the AI reads the official pricing on its own → outputs per-model, time-of-day (base/off-peak/peak + effective time) price JSON → you review and apply it (Settings page / RPC / file — pick one). Handy when the official prices change.
Development & verification
corepack pnpm install                                   # dependencies
node --check lib/index.js && node --check lib/pricing.js \
  && node --check lib/store.js && node --check lib/typert.host.js \
  && node --check lib/client.js                         # syntax checks
node test/verify.mjs

…
Comments
Comments live in GitHub Discussions. Sign in with GitHub to post or react.