
Install
Inside DeepSeek Harness, with dsh-market
dsh plugin --profile web add dshmarket
Or from the command line
dsh plugin --profile web add dsh-token-use
Installing runs third-party code with your own permissions — it can read your files, use your credentials and reach the network. Review the source first, and pin a commit (github:owner/repo#sha) when you can.
README
中文 | English
A real-time token usage and cost plugin for DeepSeek Harness: install it, then read your usage in Settings → Token usage (the plugin adds its own top-level Settings entry). The page refreshes every 5 seconds and stays quiet while the tab is hidden — no wasted polling.
Features
Four tabs across the top of the panel: Overview / By model / By project / Configuration.
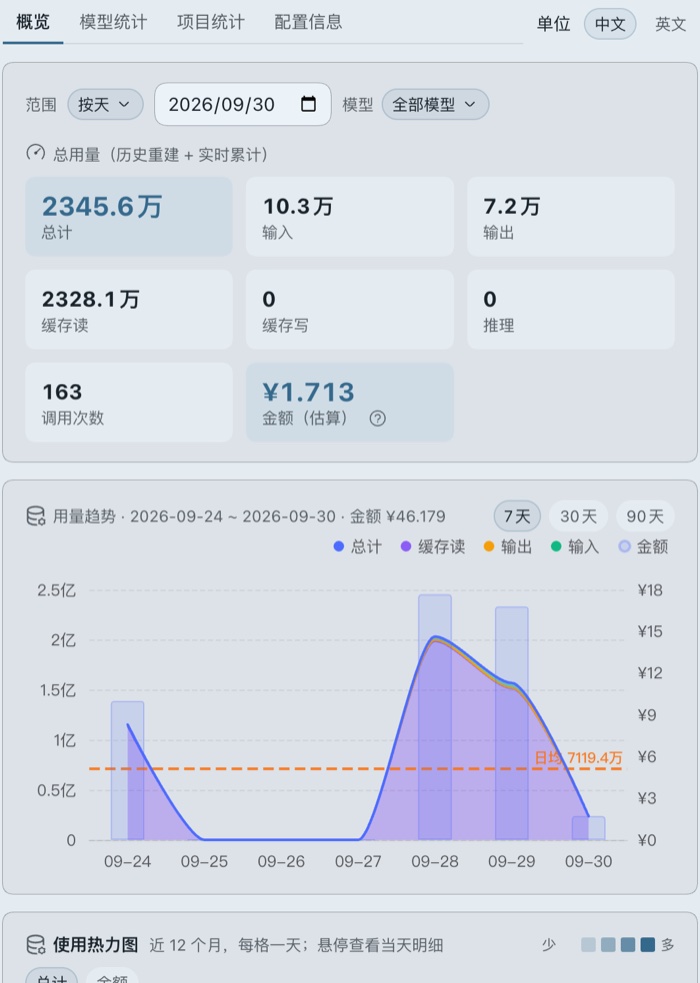
- Overview — the cost and totals cards, the trend chart, and a usage heatmap (last 12 months, one cell per day, coloured by total tokens or by cost; hovering shows that day's tokens, cost and calls instantly, without the native tooltip's one-second delay). Range and model filters apply here.
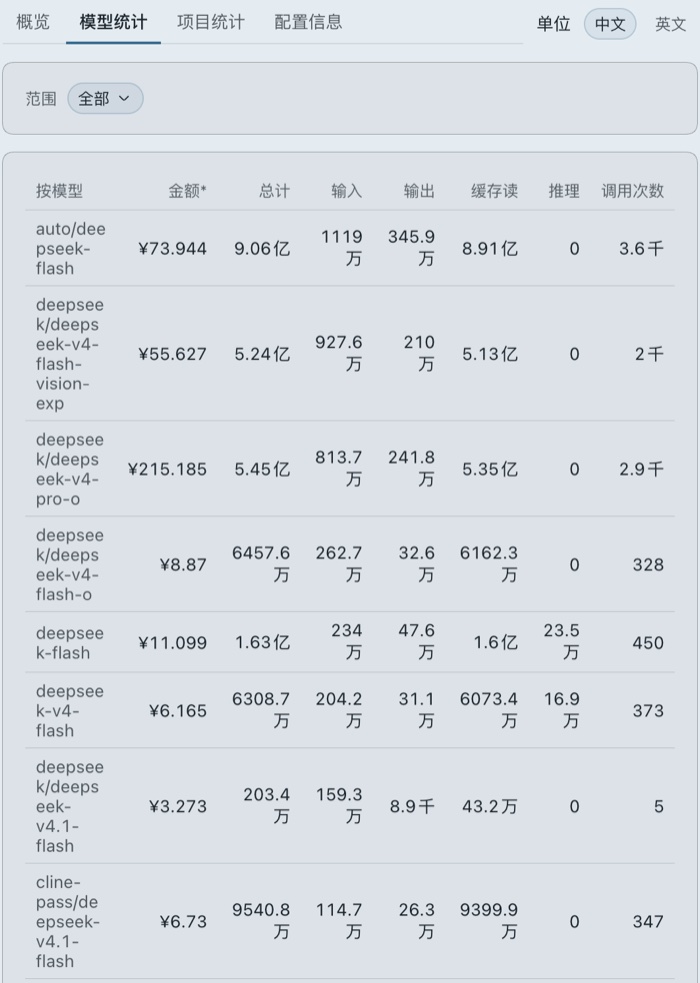
- By model — every model's usage and amount, with the same range query (day / month / year / date range / all).
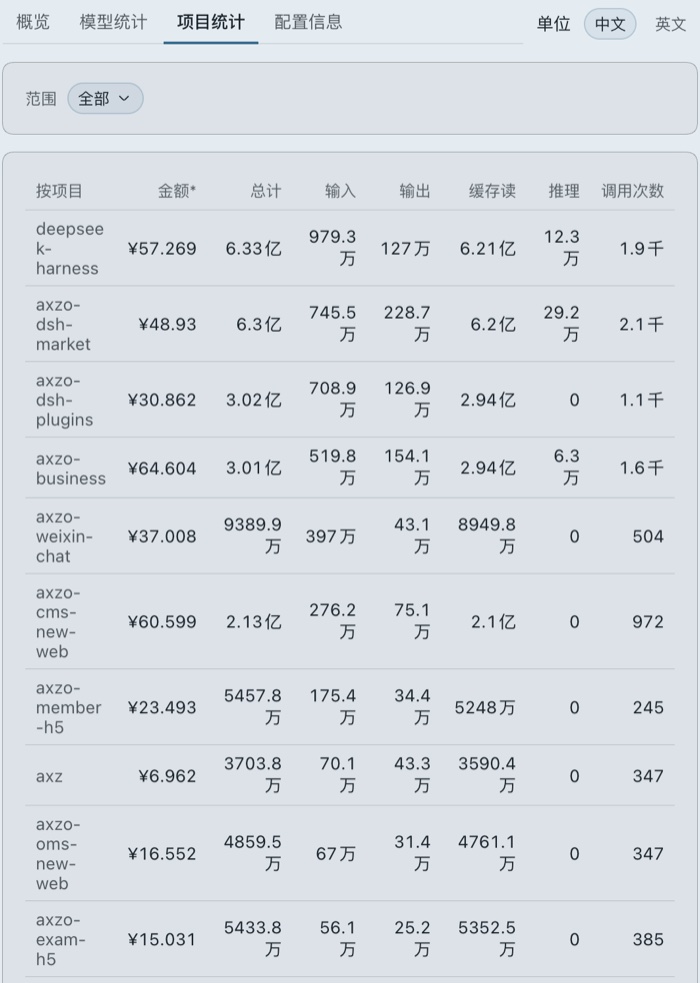
- By project — every project's usage and amount, same range query.
- Configuration — versions (
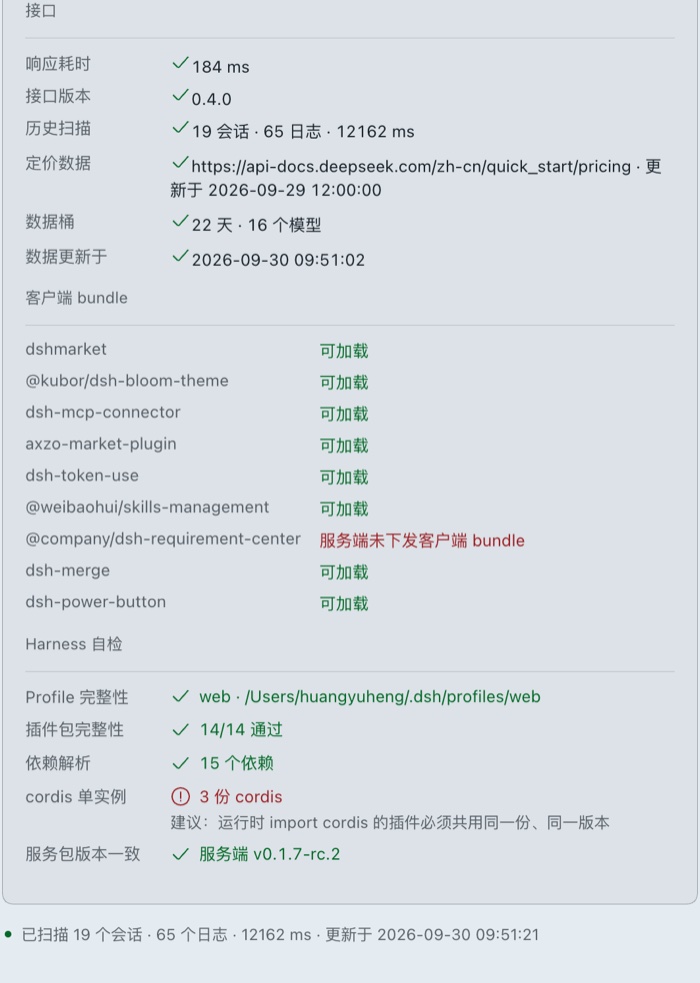
dsh-service,dsh,dsh-baseand this plugin: installed vs the newest release in the channel you run, rc/alpha/stable), runtime facts (platform version, Node version, PID, port, uptime,DSH_HOME), a health check, a confirmed one-click restart and a confirmed shutdown. - Self-check (the health check button) reports three sections: endpoint (latency, version, history scan, price data, buckets, last update), client bundles (each plugin probed at the exact revisioned URL from this page's boot manifest, i.e. what the browser really loads) and harness (profile integrity —
node_modules, lockfile, boot graph; plugin package integrity — entry file,dsh.bundle.patch, client bundle; dependency resolution; single cordis instance at one version; service bundle vs the running CLI). When a freshly installed plugin refuses to start, this names the package, the missing file and the fix. - Cost card — spend estimated live from DeepSeek's published prices × the usage recorded here, with peak/off-peak rates. Every card (totals, trend, by model, by project) carries an amount.
- Daily price book — the official pricing page is fetched once a day at 12:00 and cached locally, so restarts keep it and an offline machine falls back to a built-in snapshot.
- Totals card — estimated cost, total (input + output + cache), input, output, cache read, cache write, reasoning, calls.
- Per-model pricing — cache-hit input, cache-miss input and output are priced separately per model; anything that is not a DeepSeek model (claude, gpt, …) is never counted and shows
—. - Range dropdown — by day / by month / by year / date range / all; defaults to by day = today. The date range starts as today → today and keeps its two ends ordered, so a backwards window can never be requested; the year list offers only the years your own logs cover.
- Model filter — the dropdown beside the range selector on the overview narrows every breakdown to one model (including that model's project and per-day rows); defaults to all models.
- Trend chart — drawn with a tree-shaken ECharts bundle that ships inside the plugin (no CDN). Cache read / input / output stack into an area composition whose top edge is the total (with a total reference line), each day's amount is drawn as cost bars against a ¥ axis, and calls live in the tooltip. A prominent dashed daily-average reference line (the visible window's total ÷ its days, labelled with the value) shows at a glance whether today runs above or below your usual day. The card switches between 7 / 30 / 90 days (7 by default). A day without usage is a real zero (stacking needs it), and the tooltip still names it; tick labels keep one unit across an axis and monotone smoothing never overshoots. Rendering is imperative, so moving the mouse never re-renders React.
- Unit switch — 亿 / 万 / 千 in Chinese, B / M / K in English; remembered per browser. The tab bar and the unit switch stay pinned at the top, and the tab you were on is remembered.
- Detail tables — by model and by project (the day dimension lives in the heatmap), each with an amount column (hover a row for its rates) and a total column.
One-click restart / shutdown
Both actions at the bottom of the configuration tab share one full-screen transition: a power ring with phase copy (preparing → stopping the process → recovering → new instance ready), drawn over the whole page without disturbing the rest of the host.
- One-click restart — restarts the dsh web process serving the page. It replays the current command line (
process.argvplus the working directory), so custom ports and flags survive; it asks for confirmation first, and the page reconnects and reloads itself about 10-30 seconds later. The script lands in$DSH_HOME/dsh-token-use/restart.shand its output inrestart.log. - Shutdown — stops that process and does not bring it back; the transition ends on "you can close this page now", and you start
dsh webagain from a terminal when you need it. Its confirm button is a solid red danger button so it cannot be hit by accident. - When a launch cannot be replayed (no executable entry point), the restart button is disabled with a reason instead.
The amounts are estimates
The amount card (the last of the totals cards) carries an ⓘ icon — hover it for the full note:
Amounts are estimates: DeepSeek's published prices × the usage recorded here, priced with the peak/off-peak rate in effect at each call. Official price changes, cache accounting and reporting lag can make this differ from your actual bill — the official settlement prevails.
How it is computed:
- Priced fields:
inputTokens(cache-miss input),cacheReadTokens(cache-hit input),outputTokens(includes reasoning); DeepSeek does not charge for cache writes. - Peak/off-peak: the pricing page publishes a peak window (currently 01:00–04:00 and 06:00–10:00 UTC on weekdays, with off-peak at half price). Each record is priced with the rate in effect when it happened, so a later price change never rewrites history.
- DeepSeek models only: a model whose name does not contain
deepseek(claude, gpt, minimax, …) contributes no amount, and neither does a DeepSeek name that matches no official price entry — both are listed in the ⓘ note. - What it leaves out: auxiliary calls such as web search and session-title generation are billed, but their tokens stay server-side where nothing local can read them. They are therefore counted by number and never guessed at, and the ⓘ note lists how many happened in the window — which makes this amount a lower bound on the bill. Checked against an official hourly export: every call we do count matches it token for token and tier for tier.
- Currency defaults to CNY (the Chinese pricing page); set
currency: USDto read the English one.
Why it is worth installing
You are burning tokens, but you cannot say where: which project costs the most, which model leans hardest on the cache, how much this week grew over last week.
dsh-token-use turns that into numbers you can read at a glance. It folds every call as it happens, then lays cost, totals, input, output, cache hits, reasoning and call counts out in the settings page, with filters by model, day, month or project and a smooth trend line that tells the story. Install it and you are done: nothing to configure, no session restart, and it never pops up while you are coding.
The most expensive cost is the one you cannot see — make it visible.
Screenshots
Four tabs across the top of the panel; the shots below are the real panel on real data (Chinese number units).
Overview
Cost and totals cards, the usage trend (stacked composition + cost bars + orange daily-average line) and the heatmap (last 12 months, switchable between total tokens and cost).
By model
Every model's usage and amount, with the range query (day / month / year / date range / all).
By project
Every project's usage and amount, same range query.
Configuration
Versions (compared inside your release channel), runtime facts, the health check, the one-click restart and the shutdown — the last two ask for confirmation and run a full-screen transition.
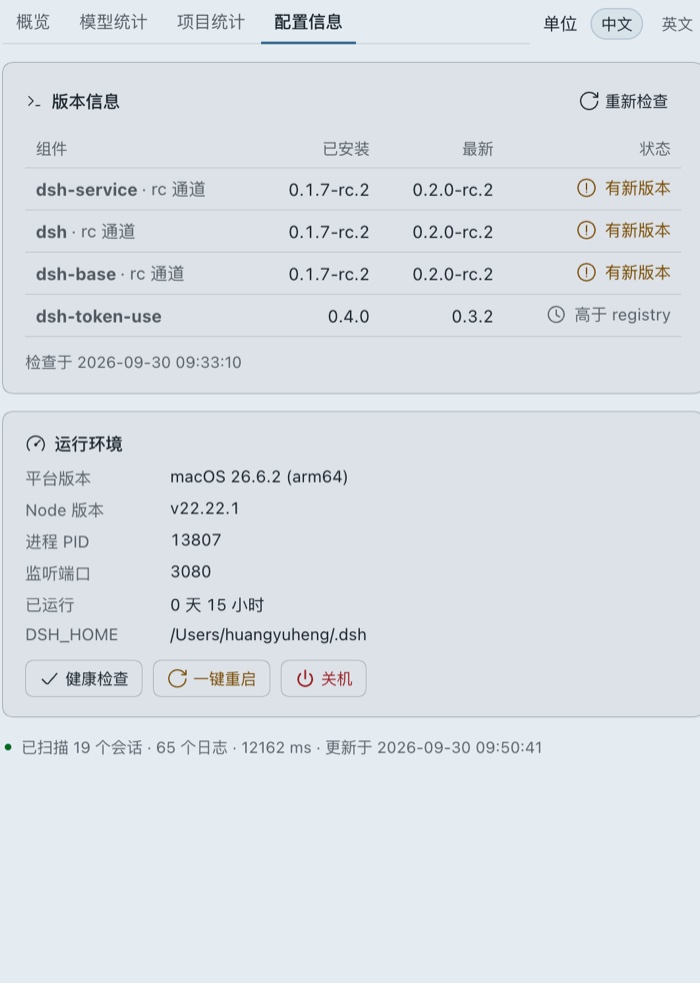
The self-check that the health button unfolds: endpoint, client bundles and the harness walk.
Install
dsh plugin --profile web add dsh-token-use
# or from source: dsh plugin --profile web add github:huangyuheng/dsh-token-use
Restart dsh web afterwards. To install from an unpacked zip instead:
dsh plugin --profile web add /path/to/dsh-token-use
Performance design
- The host side never polls and sets no periodic timer other than the daily price refresh: it folds usage in O(1) increments from the
session/eventbus (one dictionary addition and one multiplication perassistant/message). - History is rebuilt once at boot by streaming
$DSH_HOME/sessions/**/session.jsonl.zstd(native zstd fromnode:zlib), yielding the event loop between files (scheduler.yield()) so session handling is never blocked. A per-session sequence watermark de-duplicates the rebuild against live events, whatever order they arrive in. - Price refresh: one HTTPS GET per day at 12:00 local time (15 s timeout, retried an hour later on failure), stored atomically in
$DSH_HOME/dsh-token-use/pricing.json(up to 30 snapshots). A restart reads the cache synchronously and does not re-fetch; a failed fetch falls back to the built-in snapshot, so the panel always shows numbers. - Five routes are exposed (loopback only,
no-store):GET /dsh-token-usefor the snapshot,GET /dsh-token-use/configfor versions and runtime facts,GET /dsh-token-use/healthfor the harness self-check,POST /dsh-token-use/restartfor the confirmed restart andPOST /dsh-token-use/shutdownfor the confirmed shutdown (neither POST answers a GET). - How the self-check probes: client bundles are fetched at the revisioned URL from this page's boot manifest (a plugin URL embeds a build revision, so only the manifest can address it); the harness walk reads the profile directory, resolves each real entry file through
exports["."]/exports["./client"]/main, and walks up from every plugin directory to spot duplicate@deepseek-ai/cordiscopies — all read-only, never loading or executing the plugins it inspects. The report carries structured fields plus paths and versions; the panel renders the wording in your language. - Version checks read the registry's abbreviated packument (
versions+dist-tags) and compare against the highest release in the channel you run (rc / alpha / stable) —@deepseek-ai/dsh-web-appkeeps a stale0.0.1-rc.1on itslatesttag, so a plainlatestcomparison would report a false upgrade. The answer is cached for 6 hours in$DSH_HOME/dsh-token-use/versions.json.
# everything
curl http://127.0.0.1:3080/dsh-token-use
# a date / a month / a year / a span
curl 'http://127.0.0.1:3080/dsh-token-use?month=2026-09'
curl 'http://127.0.0.1:3080/dsh-token-use?day=2026-09-10'
curl 'http://127.0.0.1:3080/dsh-token-use?year=2026'
curl 'http://127.0.0.1:3080/dsh-token-use?from=2026-09-01&to=2026-09-15'
# a model (combinable with day/month/year/from+to)
curl 'http://127.0.0.1:3080/dsh-token-use?model=deepseek-v4-flash'
# versions and runtime facts (the configuration tab)
curl http://127.0.0.1:3080/dsh-token-use/config
# harness self-check (the configuration tab's health button)
curl http://127.0.0.1:3080/dsh-token-use/health
# restart the service (the configuration tab's button; degrades after 2 s and replays the same command)
curl -X POST http://127.0.0.1:3080/dsh-token-use/restart
# shut it down (the configuration tab's button; stops and does not come back)
curl -X POST http://127.0.0.1:3080/dsh-token-use/shutdown
Every bucket carries a cost (the estimate); pricing holds the current price book, when it was fetched and when it refreshes next; modelPricing maps each observed model to its rates or to the reason it carries no amount. trend spans the last 366 days — the chart takes the last 7/30/90 of it and the heatmap takes the whole run.
Development
pnpm install          # development only (esbuild + echarts)
pnpm run build        # regenerate client/client.js (= tree-shaken ECharts + client/src.js)
client/client.js is a committed build artifact, so users install nothing and build nothing.
Development loop (with this repo linked into a profile: dsh plugin --profile web add /path/to/dsh-token-use):
- Edit
client/src.js→pnpm run build→ the panel in the browser hot-reloads by itself (the host stat-polls every plugin row's client bundle, pushesrebuiltover the SSE channel/plugins/events, and the browser swaps it in) — nodsh webrestart and no page refresh; measured swap latency is under a second. - Edit
lib/*.js(the host half, e.g.pricing.js) → still needs adsh webrestart. - Hot reload requires an idempotent
apply(): a reload brings a new fiber in, and re-registering the same locale namespace or slot on top of the previous one throws, which takes the whole settings section down until the page is refreshed. The dictionaries, the rail stylesheet and thesettings.sectionregistration here all take over from the previous fiber, so reloads are safe.
The UI is built with DSH's own component library @deepseek-ai/dsh-client-ui-primitives (Button / Pill / Input / Menu / Tooltip / StateDot and its icon set): a packaged plugin just requires it, and each control degrades to a native one on a shell that predates it. When previewing a dynamic cordis plugin in creator mode — where external imports are unavailable — use window.__DSH_MODULES__.import("@deepseek-ai/dsh-client-ui-primitives") instead (the module is one of the shell's static modules; a normal Web GUI has no window.__DSH_MODULES__).
Published to npm as dsh-token-use; its repository field points back here, which is how the official market links the package and shows download counts. To cut a release: bump version, run npm publish, and users pick it up with dsh plugin update or the market's update button.
Field definitions
input/output— input and output tokens as reported by the API.cacheRead/cacheWrite— prompt cache read/write tokens (the API counts cache reads on the input side for billing).reasoning— reasoning tokens.cost— the estimate from those fields and the rates in effect; cache writes are not billed and reasoning is already inside output, so nothing is counted twice.auxiliary— how many auxiliary calls in the window the amount leaves out (searchweb search,titlesession titles).- Model attribution — the model of the session's most recent
request/header; small calls that carry no usage record (title generation, for example) are not counted. - Project attribution — the
cwdin the session's creation header (live events readsession.header.cwd, history reads the log header); subagent and forked sessions inherit their parent's project; usage that cannot be attributed yet is held and back-filled as soon as it resolves, only reaching(no cwd)after 30 seconds. |
Compatibility
These differences are already handled before anyone else installs the plugin:
| Dimension | Notes |
|---|---|
| Runtime | Requires dsh web ≥ 0.1.0-rc.6 (the settings sidebar settings.section slot). The host half uses Node built-ins only; zstd decoding uses node:zlib (built in from Node 22.15, and dsh itself requires ^22.19 || >=24, so it is always present). |
| Settings rail glyph | The shell hardcodes the rail glyph per section id and falls back to the same settings gear for every unknown id (ours and the market plugin's alike) — a slot registration cannot name an icon. The plugin masks its own bar-chart glyph over that gear with a structure-only selector anchored on a marker class inside its own label: no dependency on the shell's hashed class names, and if a future shell changes the markup the selector stops matching and the gear simply stays (never two glyphs), with no functional impact. |
| Data directory | Resolved from $DSH_HOME (environment variable, defaulting to ~/.dsh), matching dsh's own dsh-home-paths rules; a custom home works too. Recorded usage is read-only; the only file written is the price cache $DSH_HOME/dsh-token-use/pricing.json (atomic replace), and pricing.enabled: false turns both the fetch and that write off. |
| Session formats | Handles session.jsonl[.zstd] (multi-frame zstd with checksums), the versioned next generation session.v<N>.jsonl[.zstd] that dsh leaves alongside the old file after a migration, and plaintext .jsonl. A session is read from its highest-version generation only, so a migration never double counts; .bak, .corrupt-* and session.lock are skipped, and a single corrupt frame only raises scan.skipped. |
| Directory layout | Follows the official JSONL persistence layout sessions/<project dir>/<session dir>/, reading every session independently. |
| Accounting | Some providers (the pi-ai adapter, for instance) fold reasoning tokens into output, so a reasoning column of 0 is normal there; calls that record no usage (title generation, web search) are not counted; model attribution uses the session's most recent request/header. |
| Network | The endpoint is loopback-only by default. On a LAN deployment (trustedHosts configured) set allowRemote: true in the profile patch; it still accepts same-origin requests only, and the client names the reason when it sees a 403. Outbound traffic has exactly one purpose: fetching the official pricing page from api-docs.deepseek.com once a day (repoint it with pricing.url, or turn it off with pricing.enabled: false). |
| Performance | The history rebuild runs on a worker thread, so the host event loop is never blocked; events arriving meanwhile are buffered and replayed after the scan, with the session sequence watermark keeping the two folds distinct. Only event increments happen afterwards. |
| Multiple instances | Every $DSH_HOME is counted separately; several profiles under one home share the sessions directory, so their usage is merged. |
Configuration (overridable in cordis.patch.yml)
- id: dsh-token-use
  name: 'dsh-token-use'
  config:
    endpoint: /dsh-token-use
    scanAtBoot: true    # false counts only usage recorded after the plugin starts
    allowRemote: false  # set true for LAN (non-loopback) access; same-origin only
    pricing:
      enabled: true     # false turns the daily fetch off (built-in/existing snapshots only)
      currency: CNY     # CNY (Chinese pricing page, 元) or USD (English page, $)
      refreshHour: 12   # local hour of the daily fetch
      # url: https://api-docs.deepseek.com/zh-cn/quick_start/pricing  # custom pricing page
After installing
- Restart
dsh web(a bundle membership change only takes effect on restart); - Open Settings → Token usage;
- Or from the command line:
curl 'http://127.0.0.1:3080/dsh-token-use?month=2026-09'.
Comments
Comments live in GitHub Discussions. Sign in with GitHub to post or react.