
Install
Inside DeepSeek Harness, with dsh-market
dsh plugin --profile web add dshmarket
Or from the command line
dsh plugin --profile web add github:940842546/dsh-usage-billing
Installing runs third-party code with your own permissions — it can read your files, use your credentials and reach the network. Review the source first, and pin a commit (github:owner/repo#sha) when you can.
Screenshots
README
中文 | English
A build-free dual-face plugin for DeepSeek Harness: tracks every DeepSeek model call across all sessions, bills them by official pricing, and provides charted usage panels on the main UI and the settings page.
Billing: legacy prices before 2026-08-17 00:00 (Beijing time); peak/off-peak pricing after that (peak = weekdays 9:00–12:00 & 14:00–18:00 (effective 2026-08-23; before that weekends also counted as peak); off-peak is half the peak rate; from 9/10 12:00 the flash series reprices again (off-peak hit 0.02 / miss 1 / out 4, peak ×2, pro unchanged; V4 Pro continues after 9/14 at unchanged pro rates (a routing toggle is kept for a future official change; currently off))). Public holidays and make-up workdays bill off-peak all day (the 2026 State Council schedule is built in; extra dates can be added in settings). Price table at the bottom.
Features
- Automatic tracking: listens to
llm/streamand records every model call (input / output / cache hit / cache miss tokens) - Historical backfill: on first start, scans local session logs to rebuild historical usage and cost, with session titles
- Tiered billing: each call falls into "pre-change · legacy", "post-change · peak", or "post-change · off-peak" by Beijing time (since 2026-08-23, peak applies on weekdays only; before that weekends also counted as peak; public holidays and make-up workdays are off-peak all day — the holiday list is editable in settings, so the 2027 schedule can be added once published)
- Budget alert notifications: desktop toast when crossing 80%/100% thresholds (once per threshold per day), plus progress bars (orange near 80%, red when over)
- Configurable pricing: price table, peak hours, boundary date, and USD exchange rate are all editable (changes apply to subsequent calls only), with one-click reset to defaults
- Export: one-click CSV (daily / per-session, filename includes the date range) or JSON export for accounting
- Official balance: auto-detects the configured DeepSeek API key and fetches the official account balance (total / topped up / granted), refreshing every 10 minutes; silently skipped when no key is configured
- Balance runway: estimates days left and the projected exhaust date from the 7-day average spend
- Alert history: recent budget alerts listed in the settings page
- Daily trend chart: 30-day daily cost bars in the settings page
- More robust storage: writes keep a .tmp copy and auto-recover from it when the main file is corrupt; multi-instance heartbeat detection warns about concurrent writes
- Main UI:
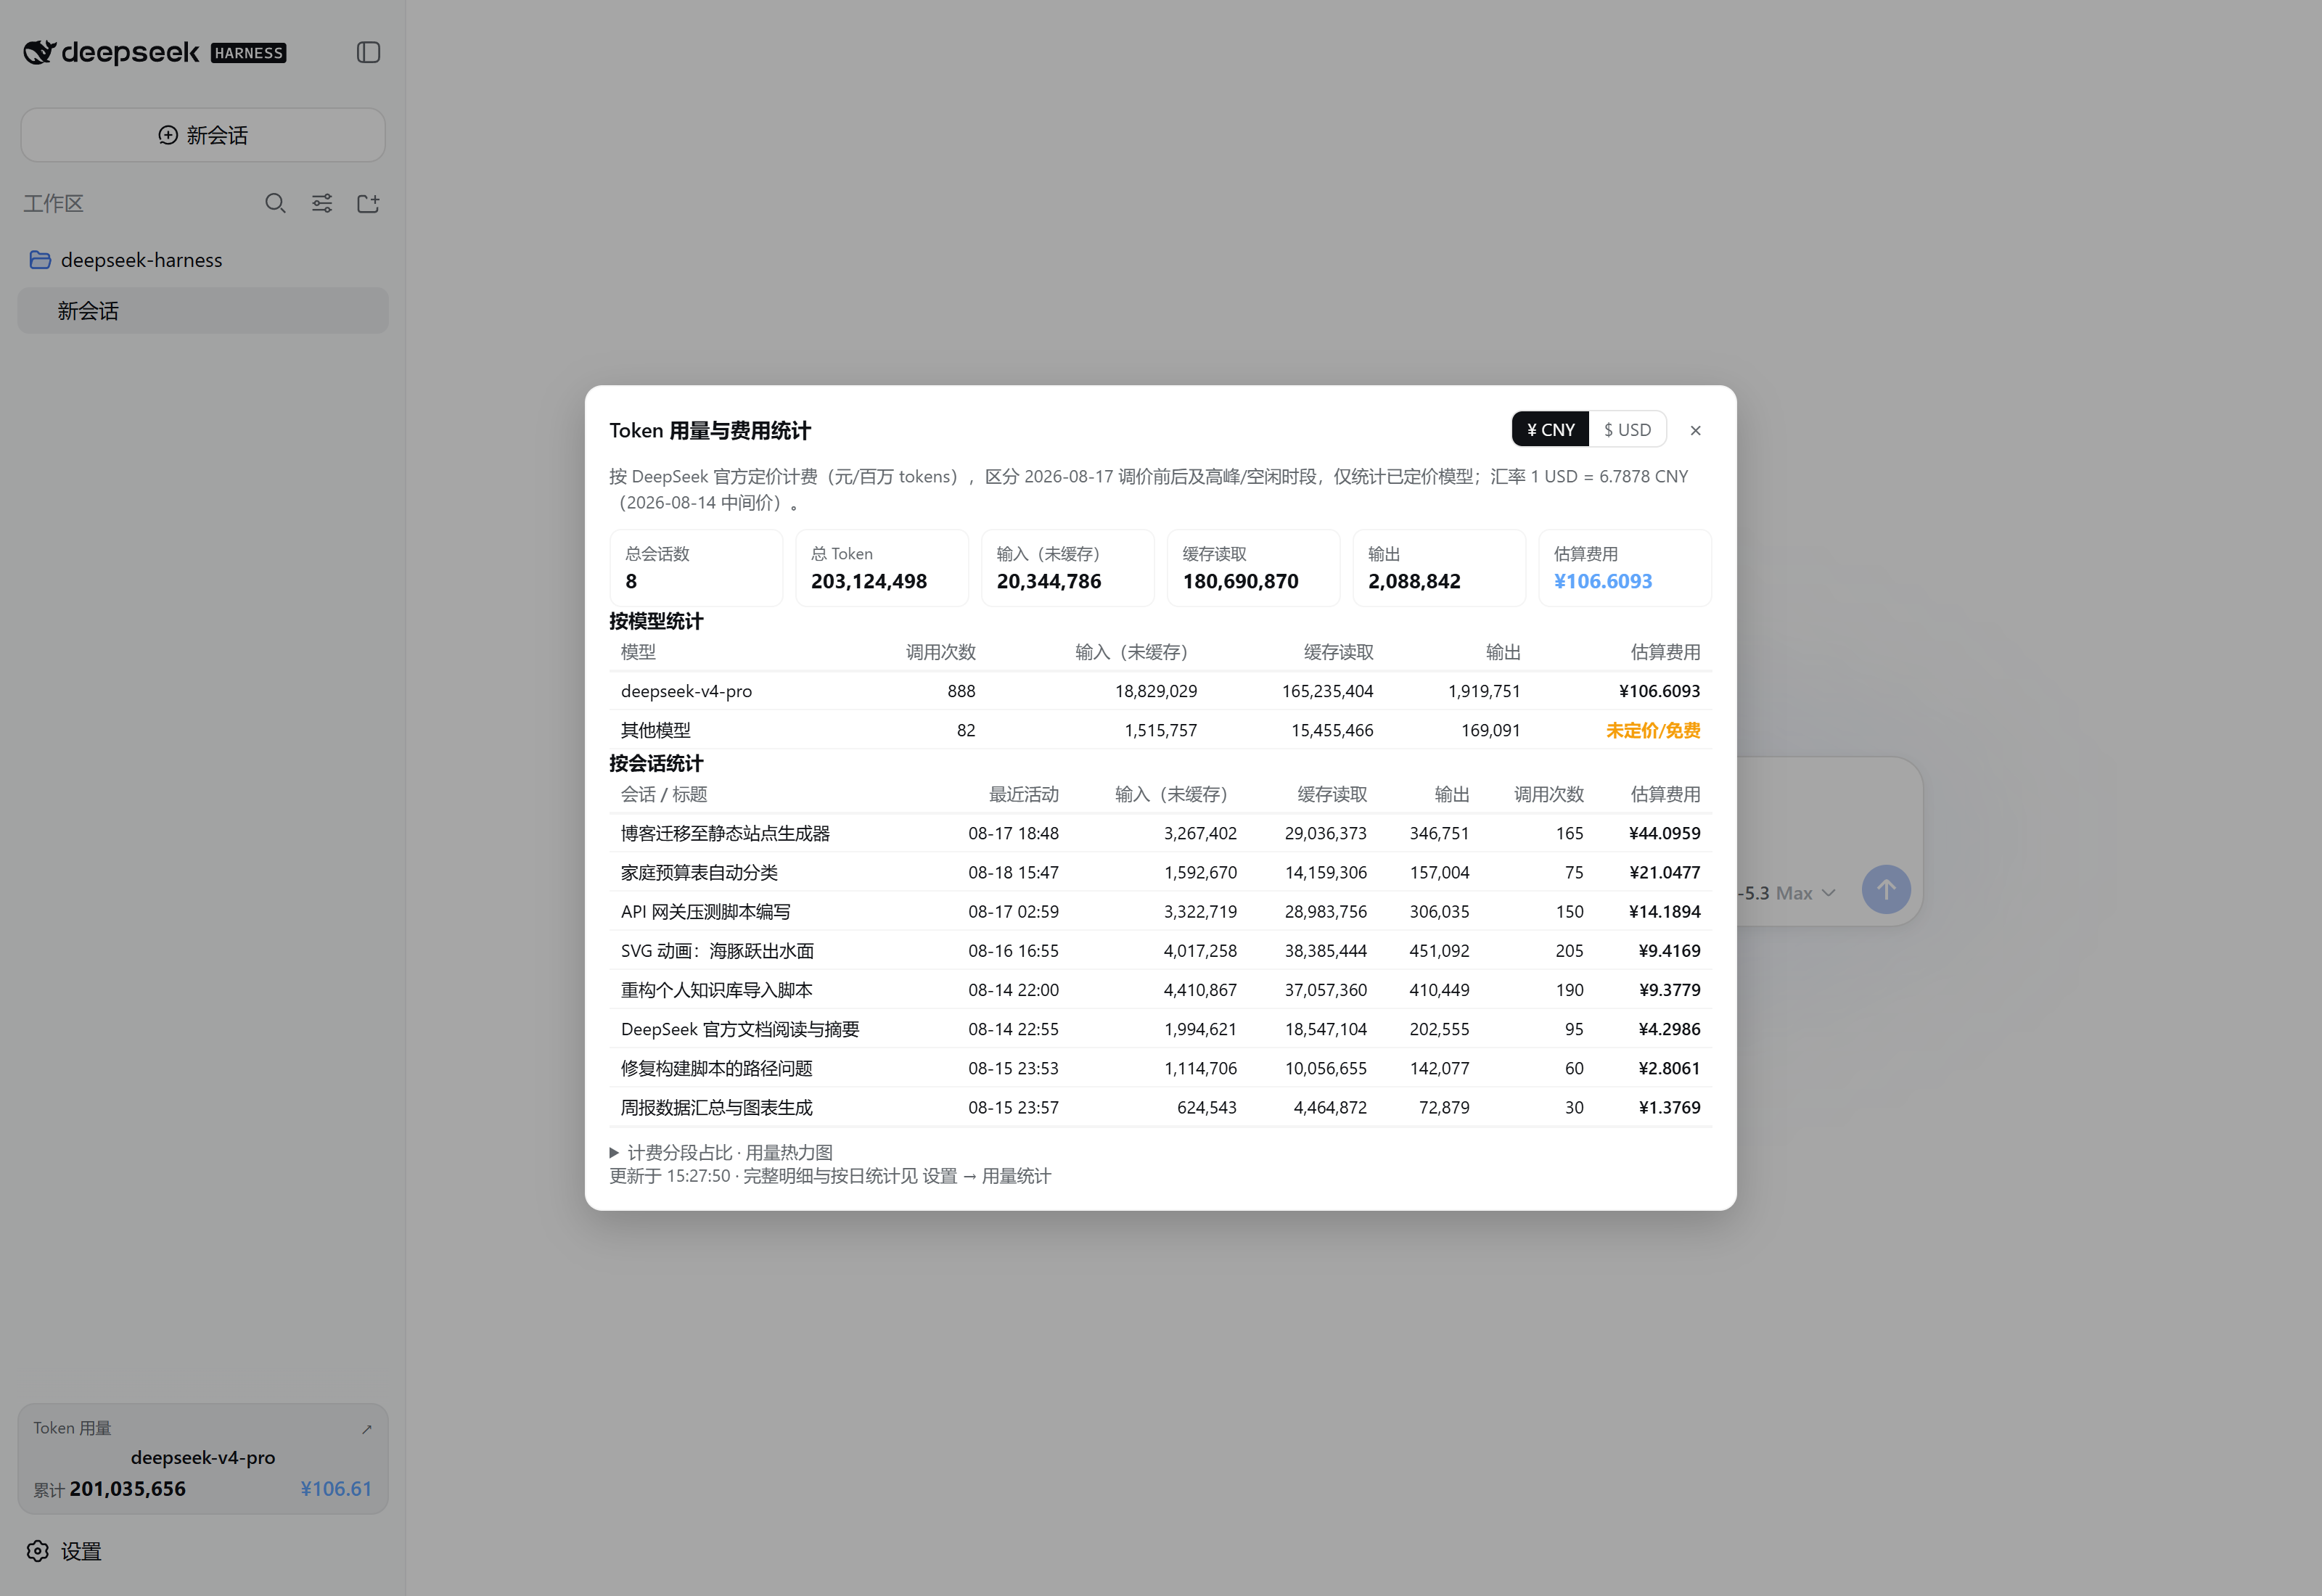
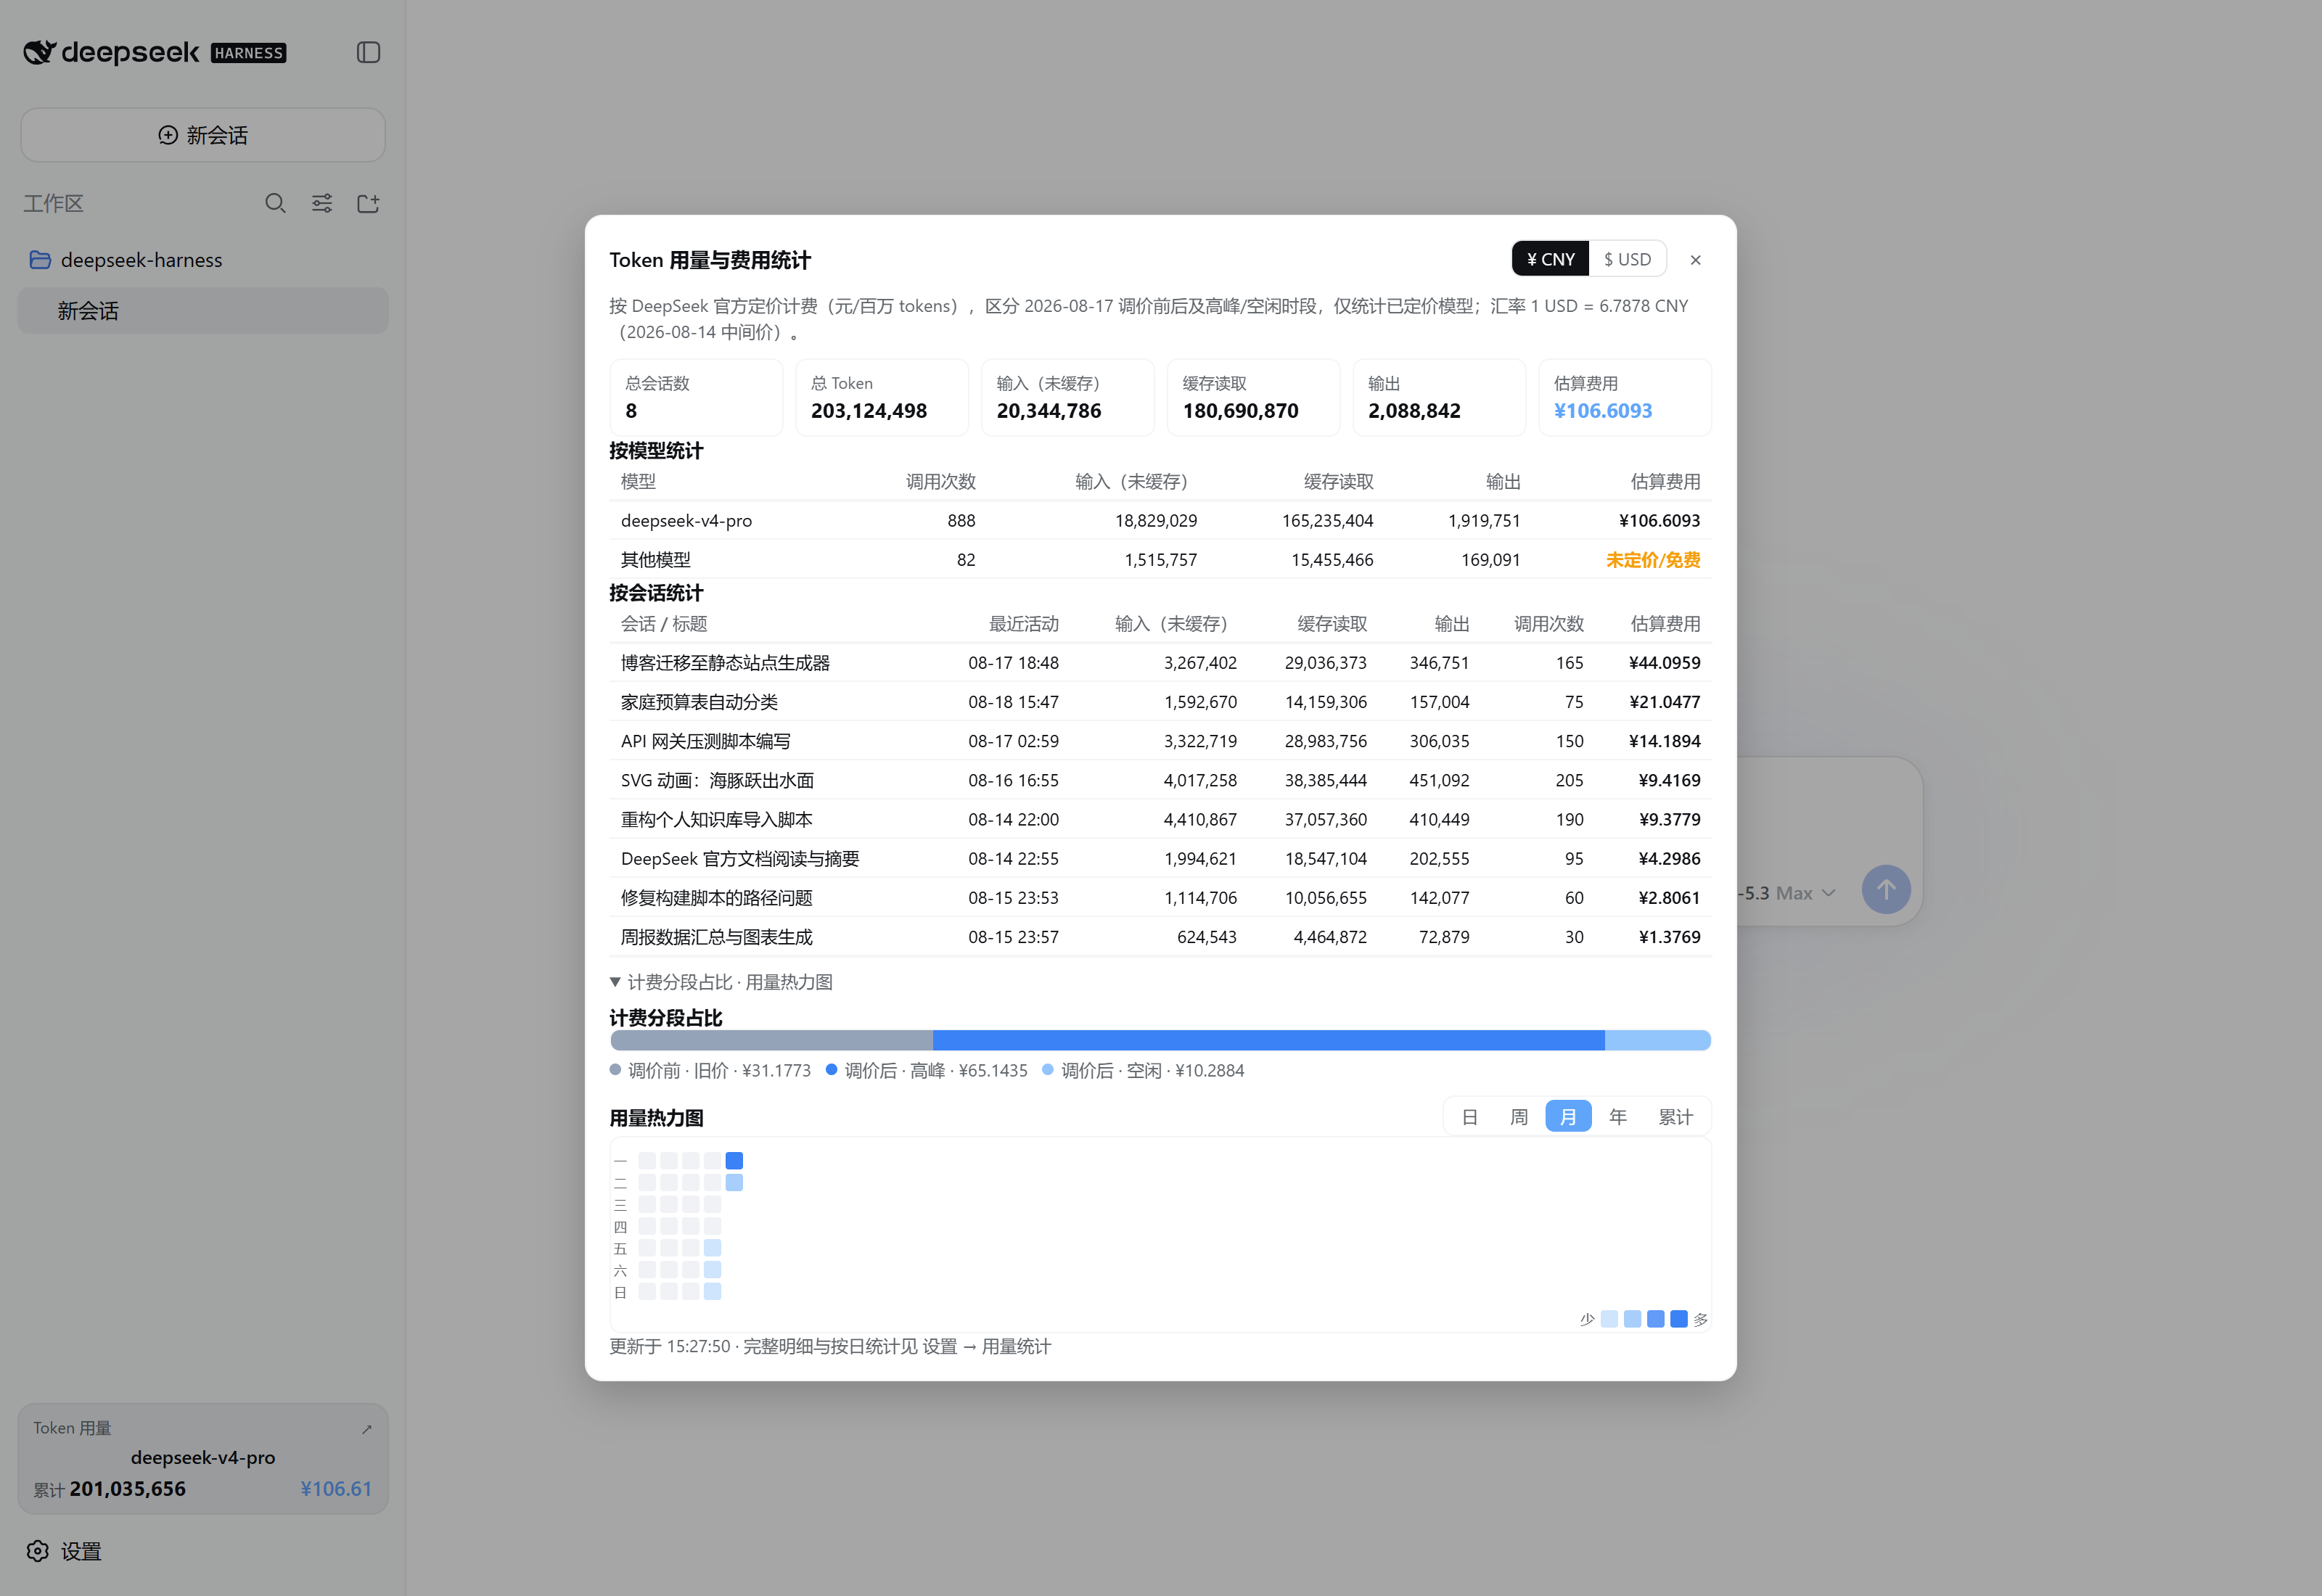
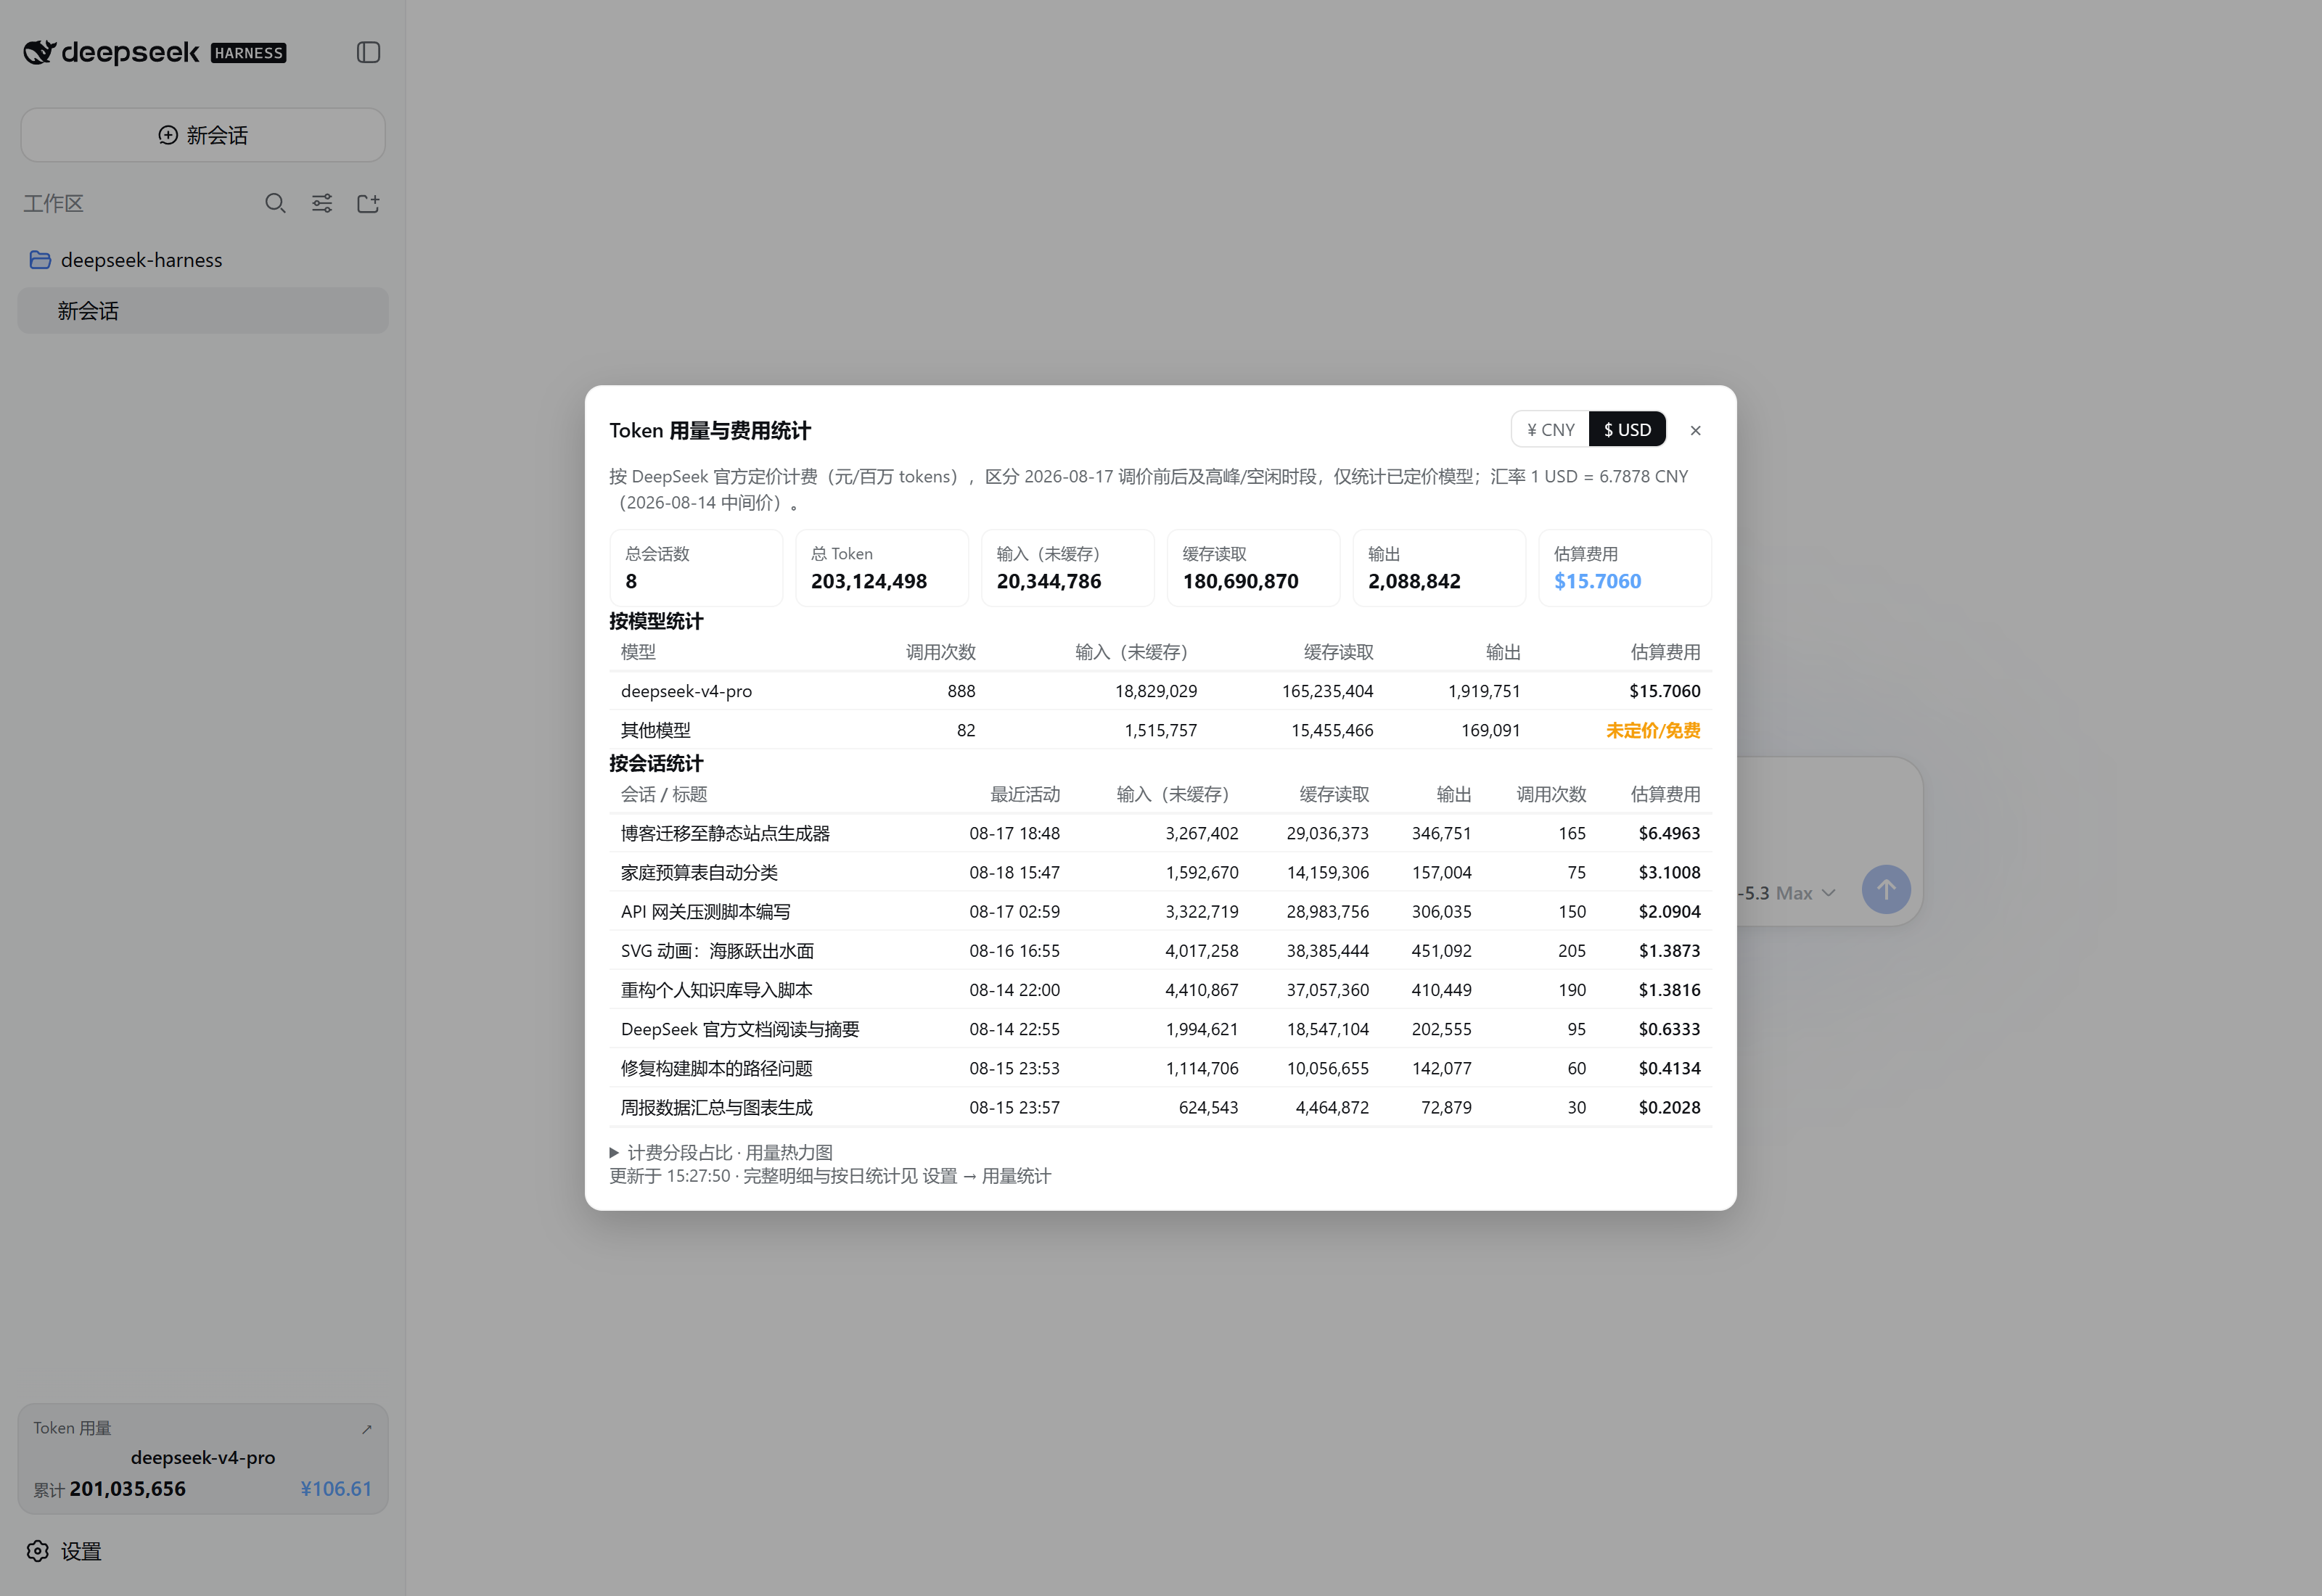
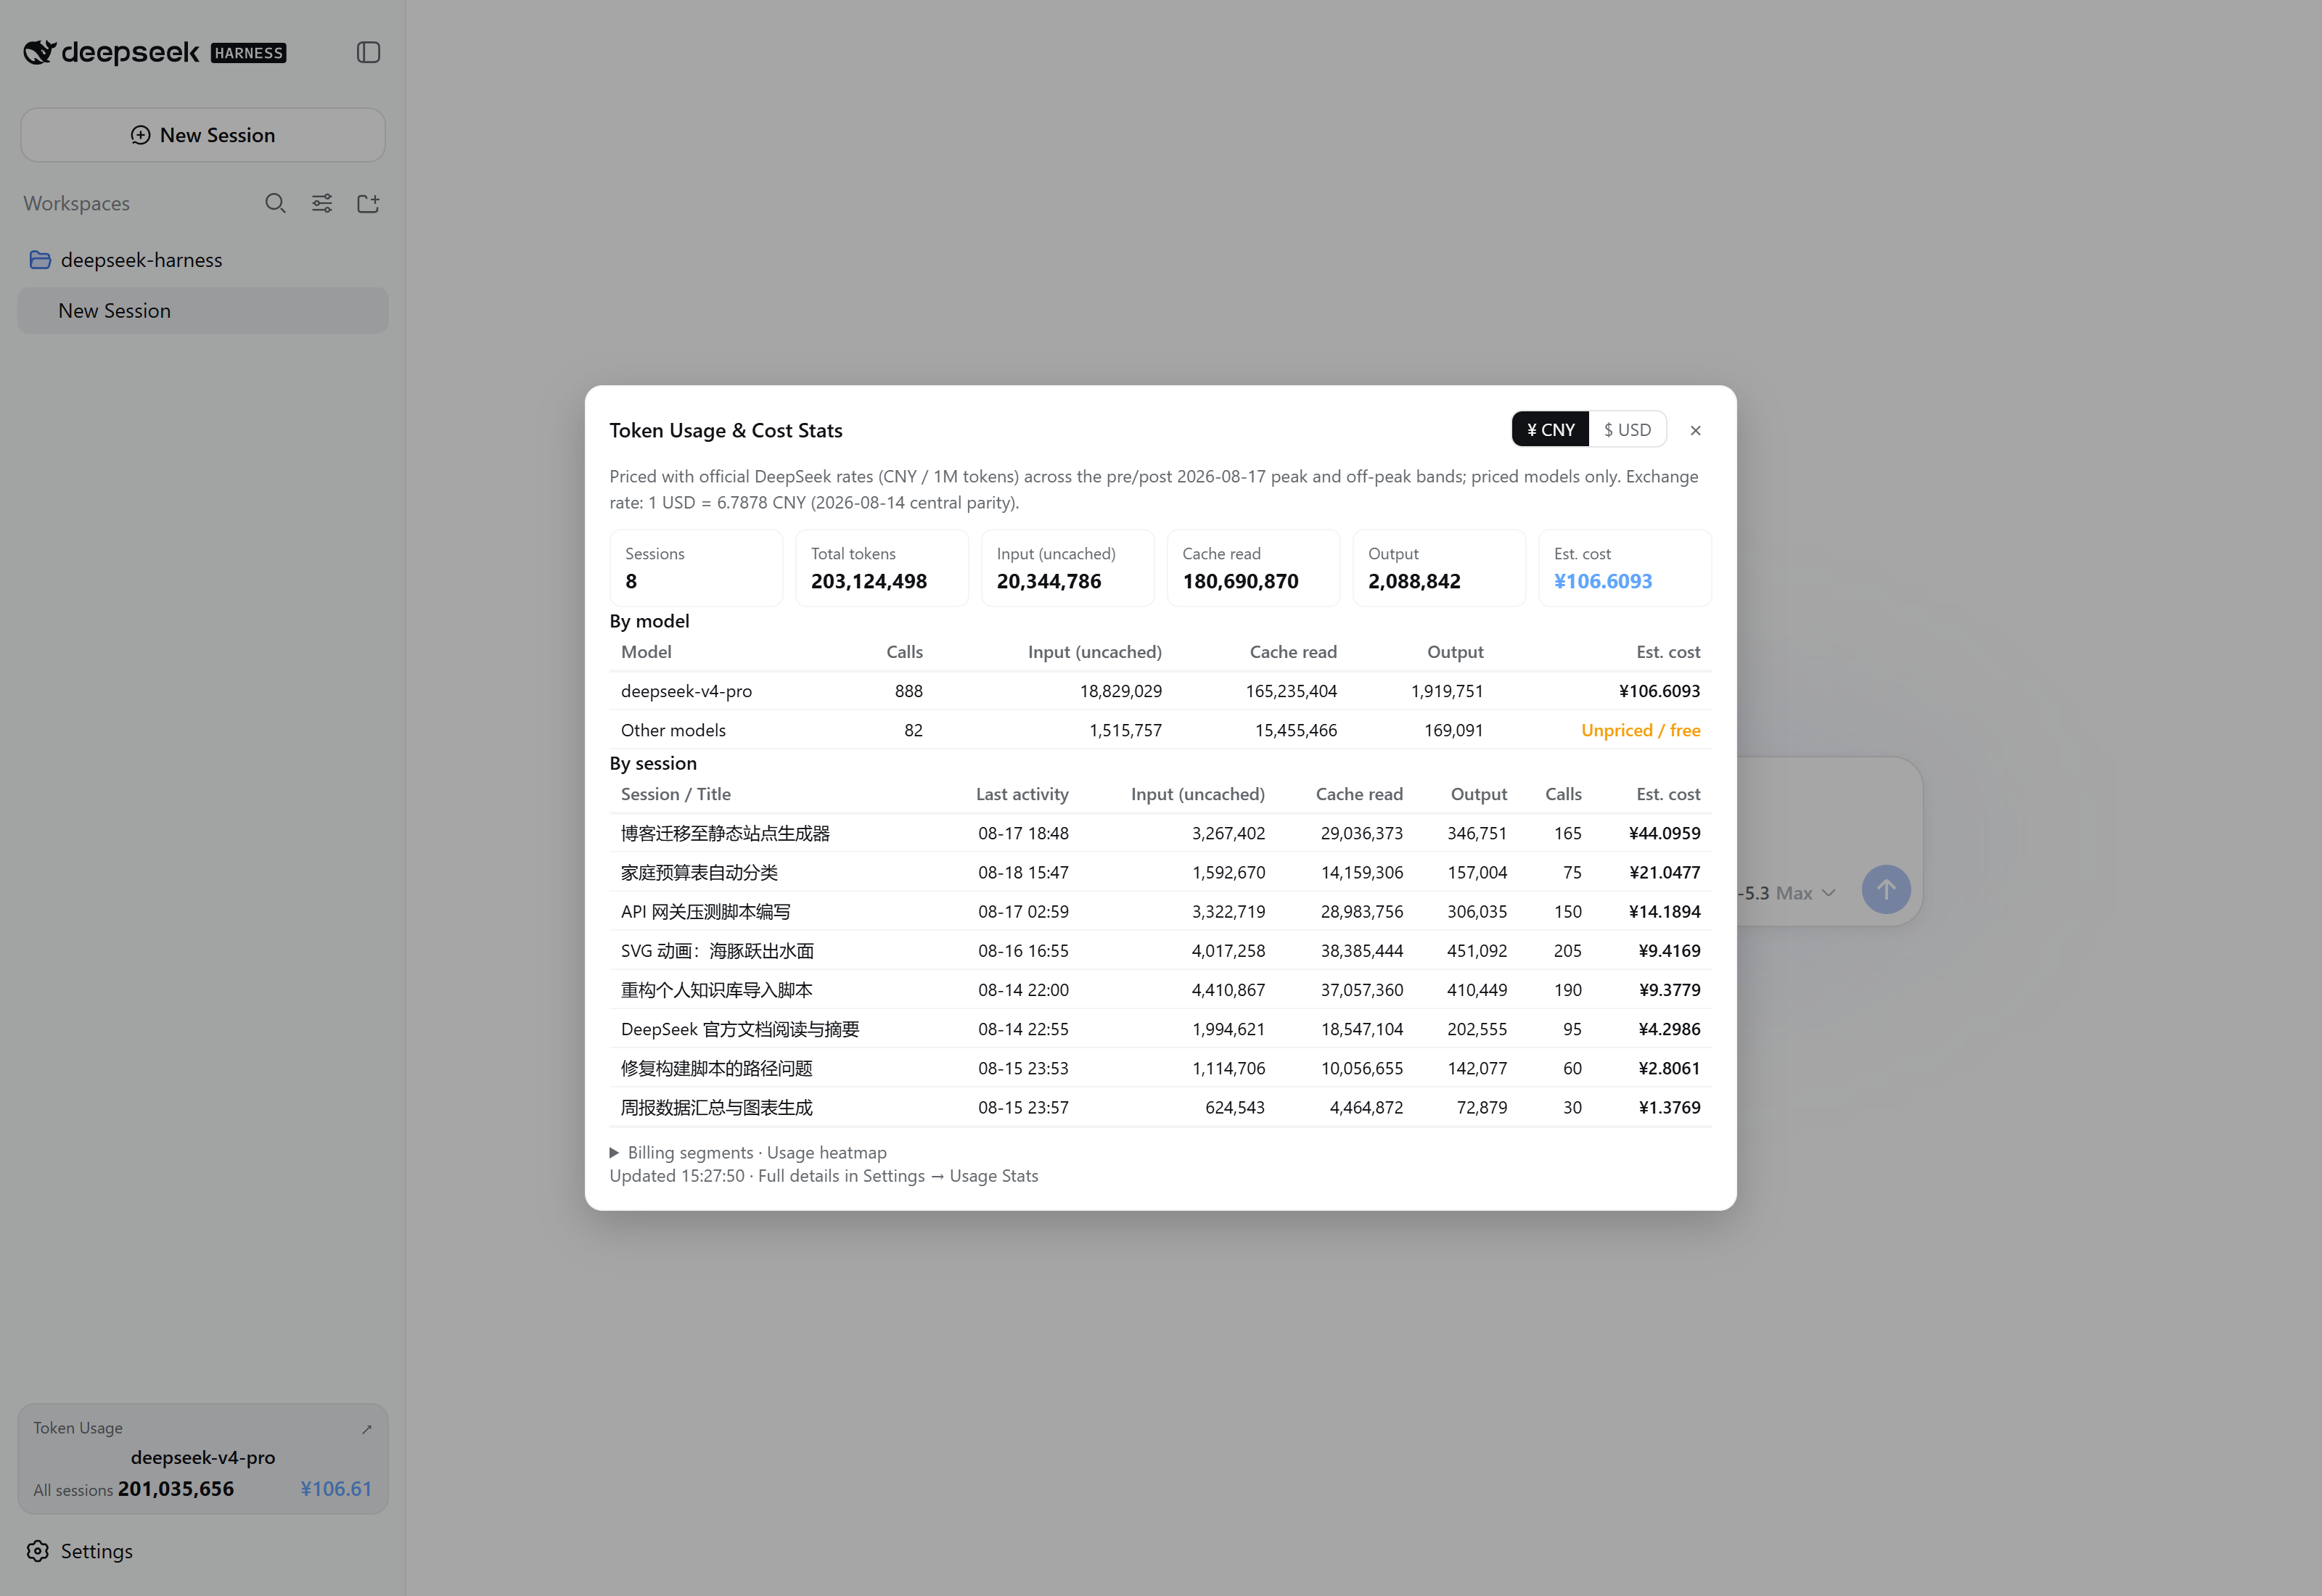
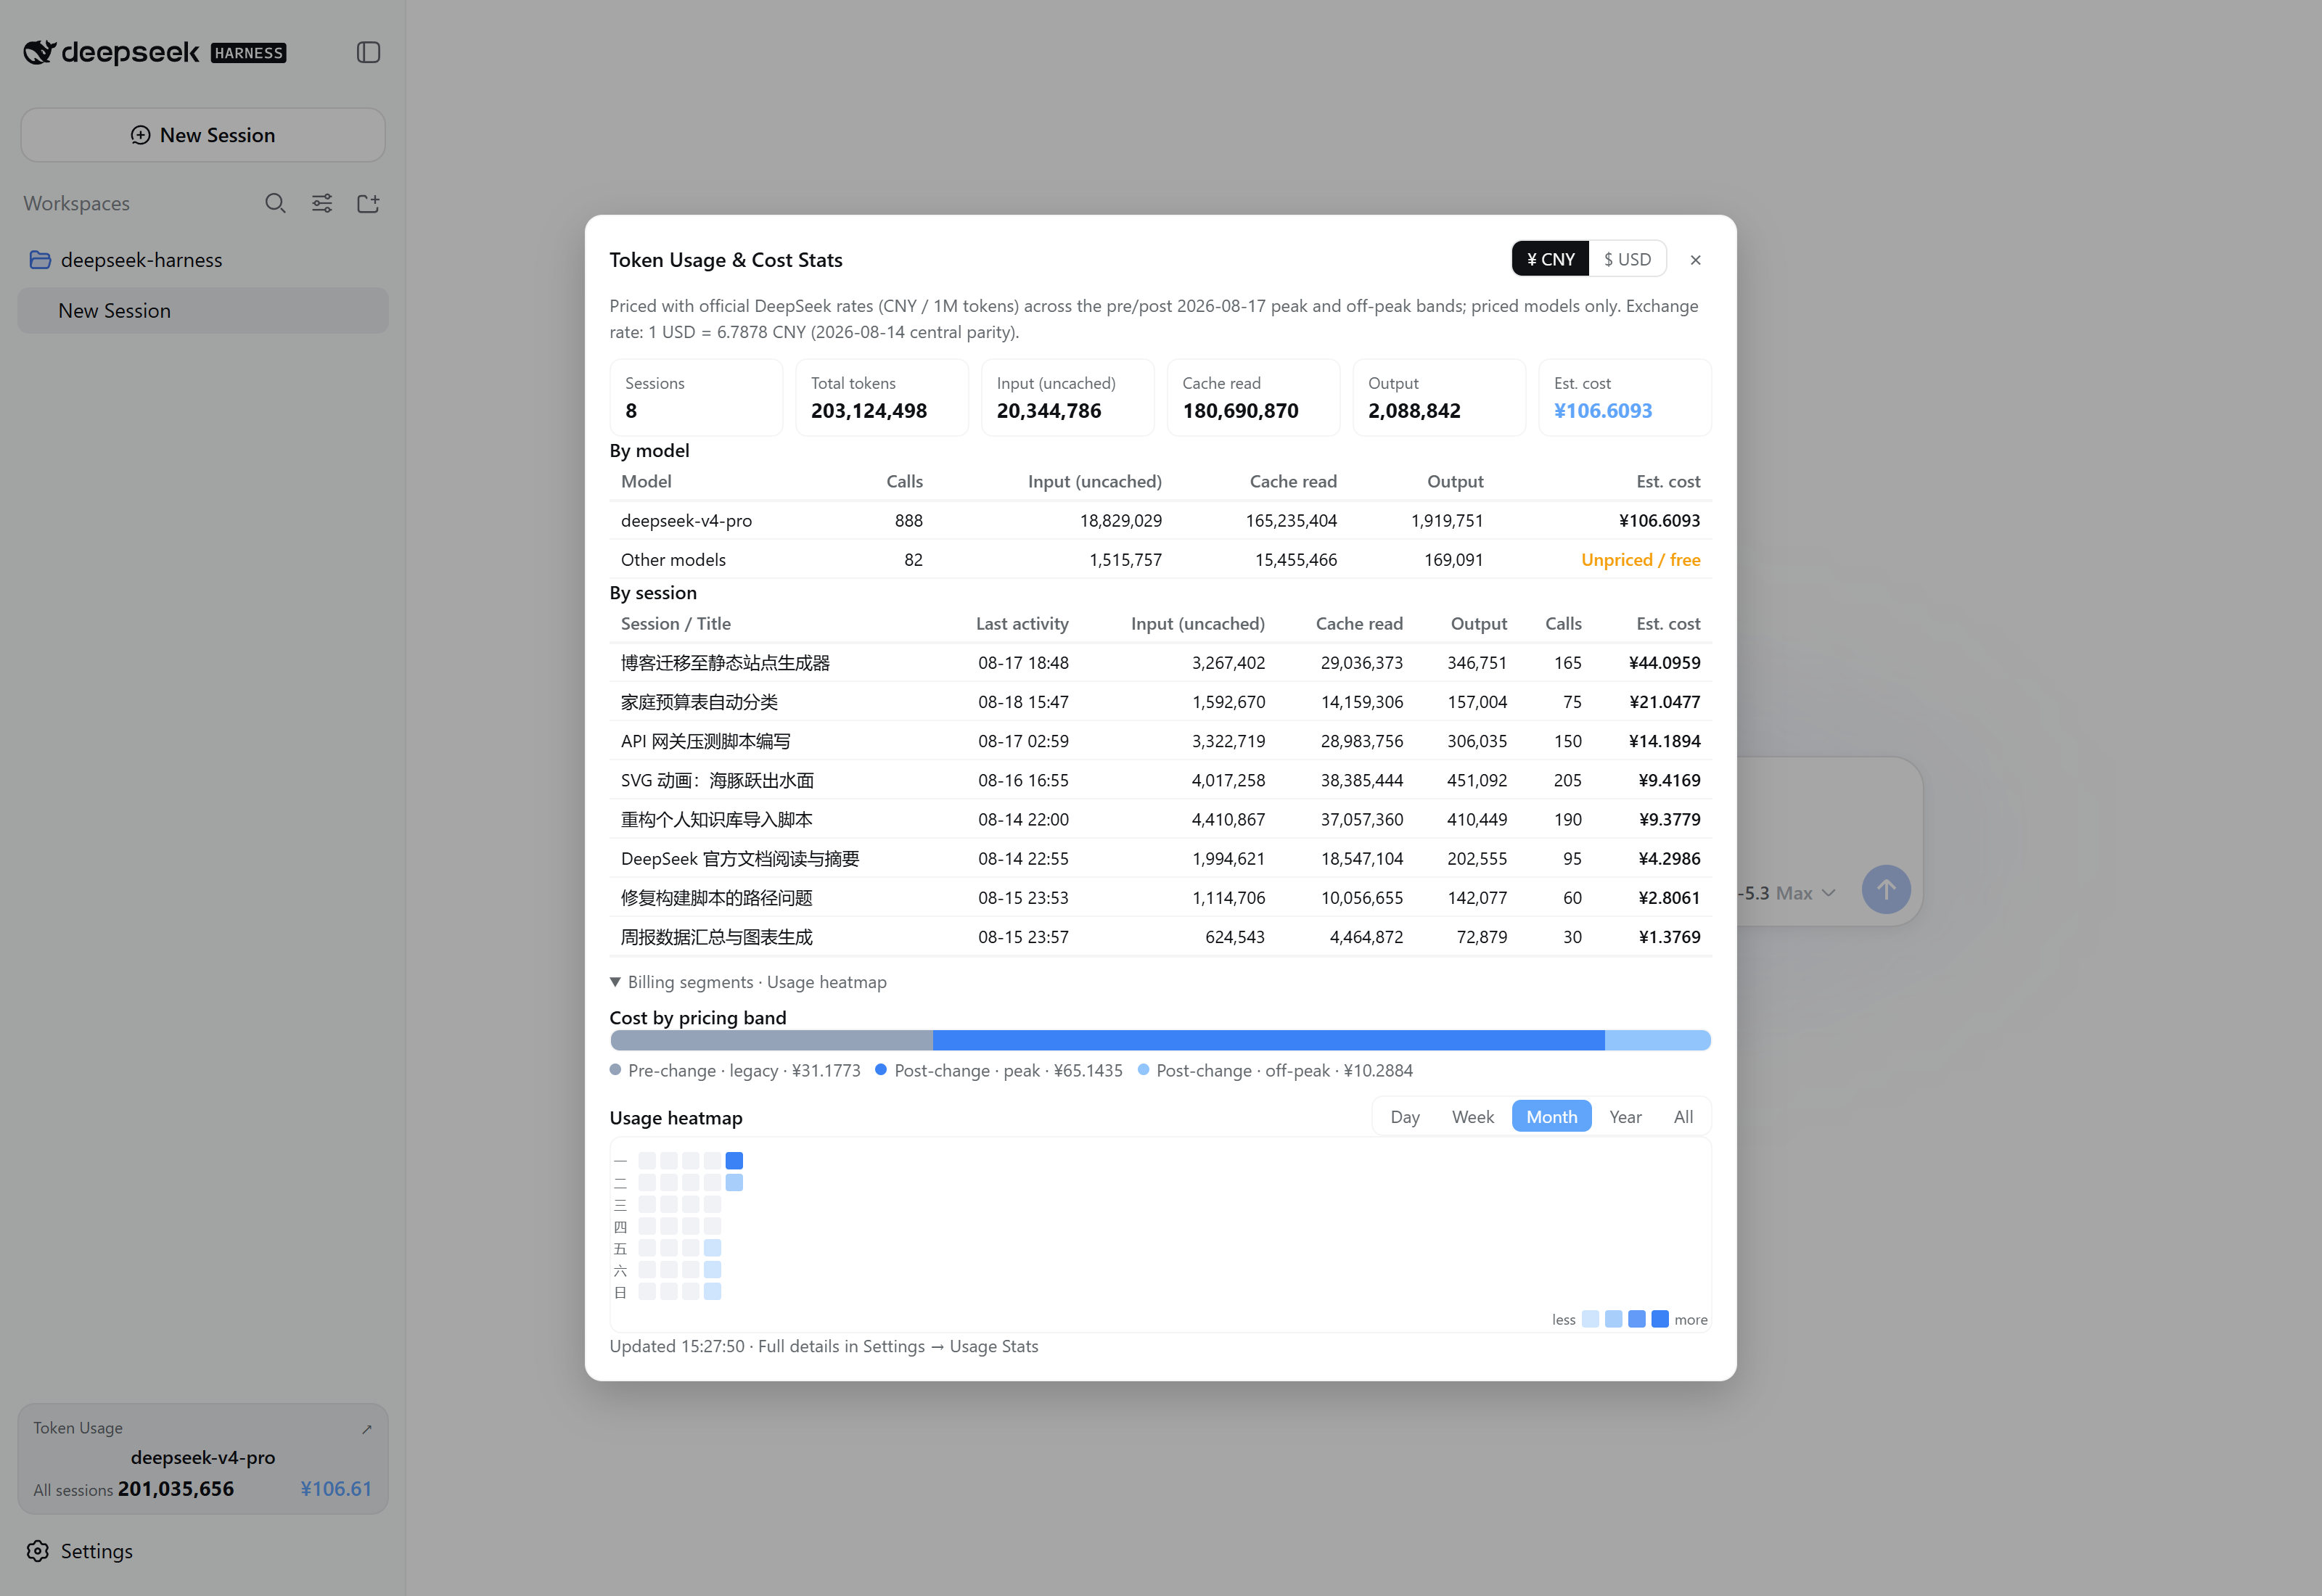
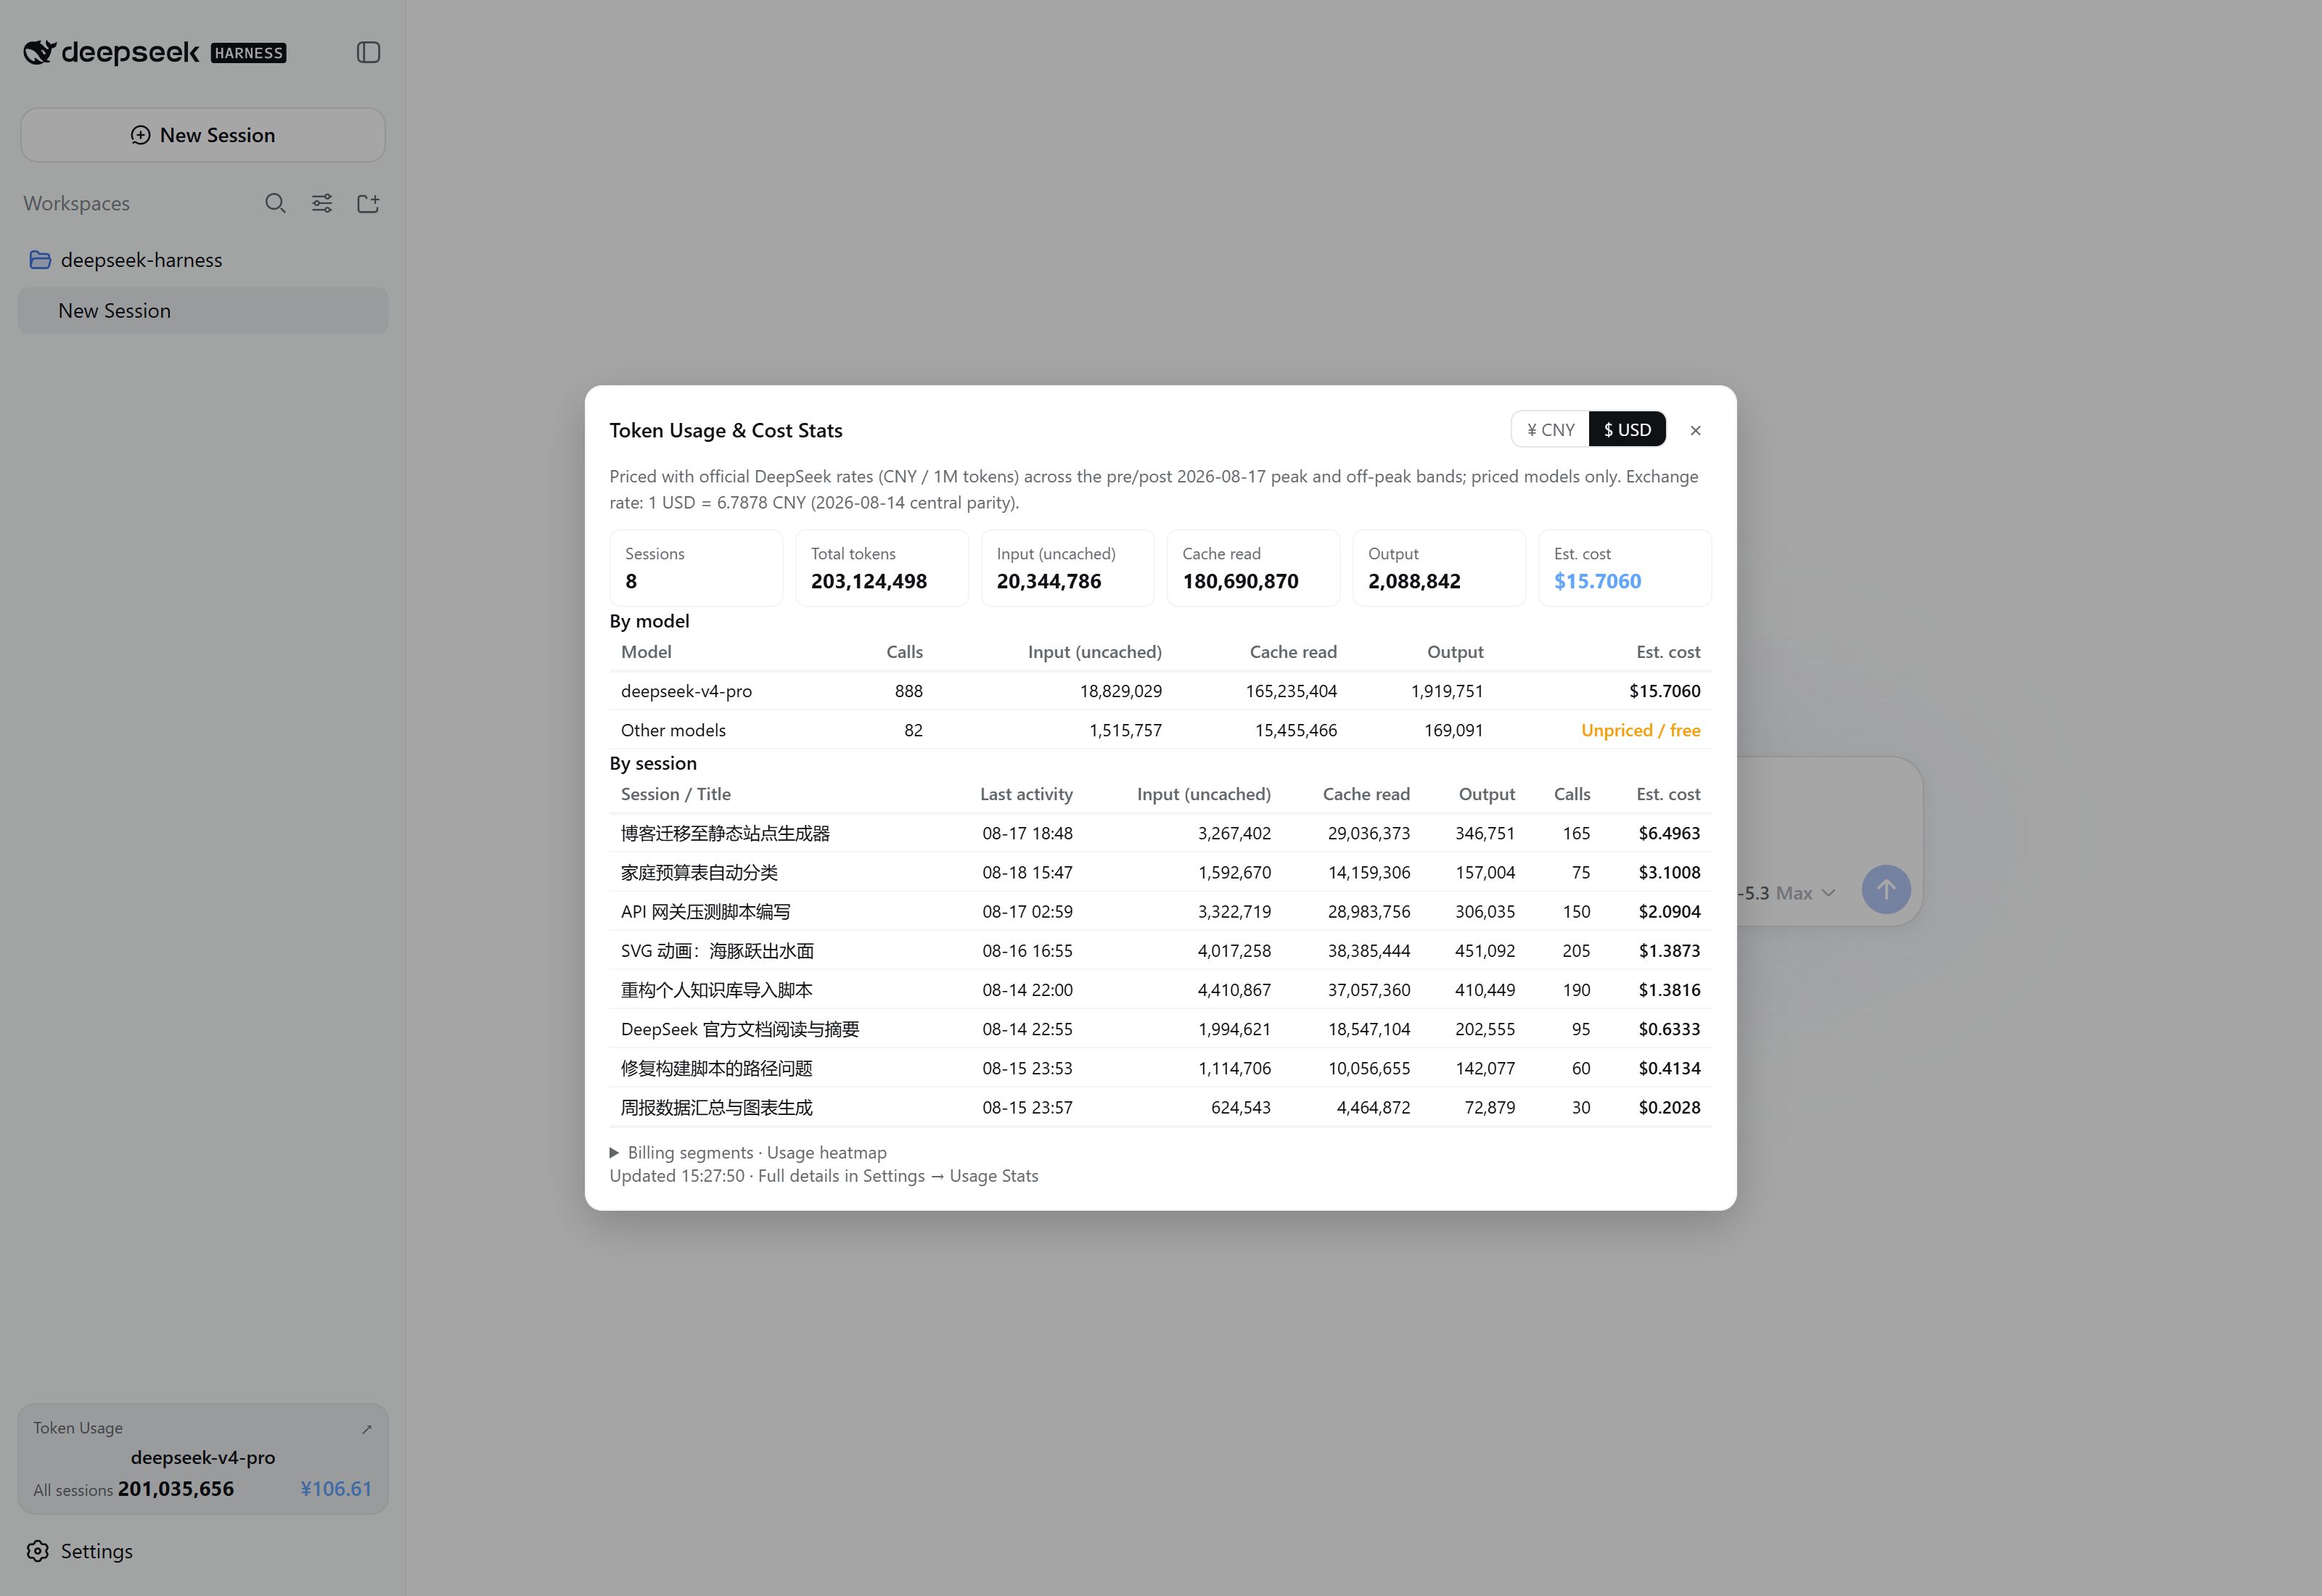
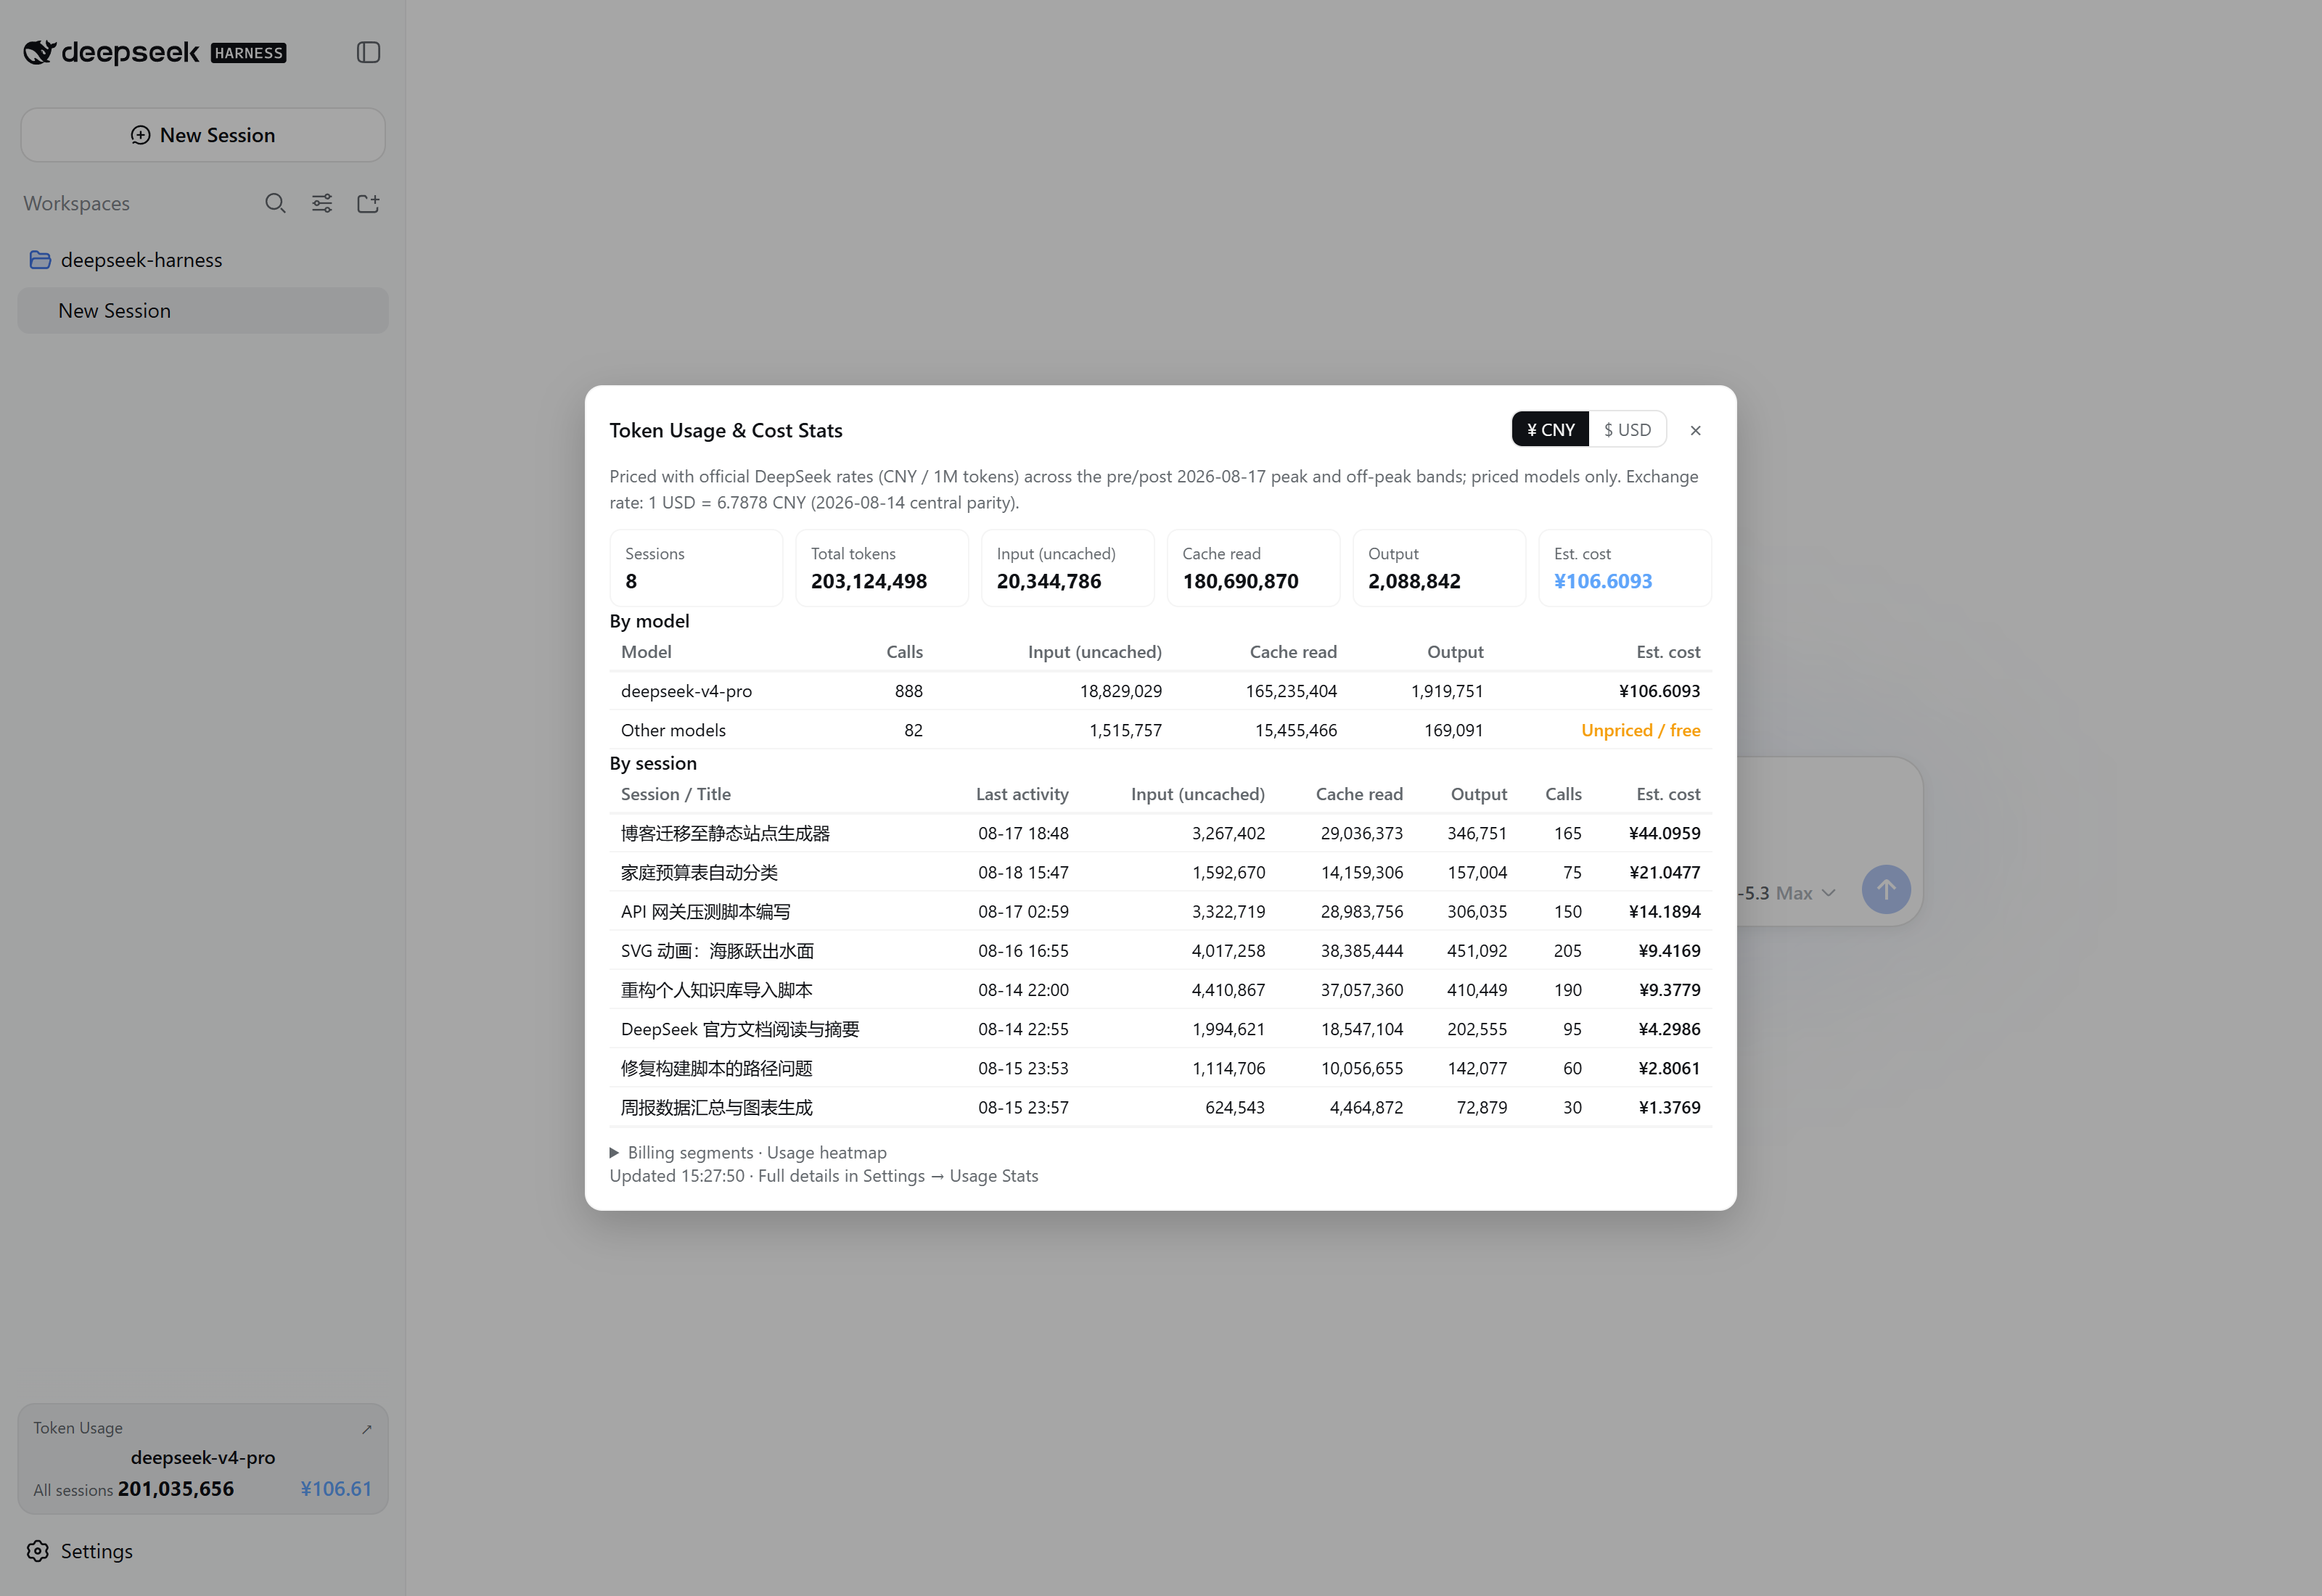
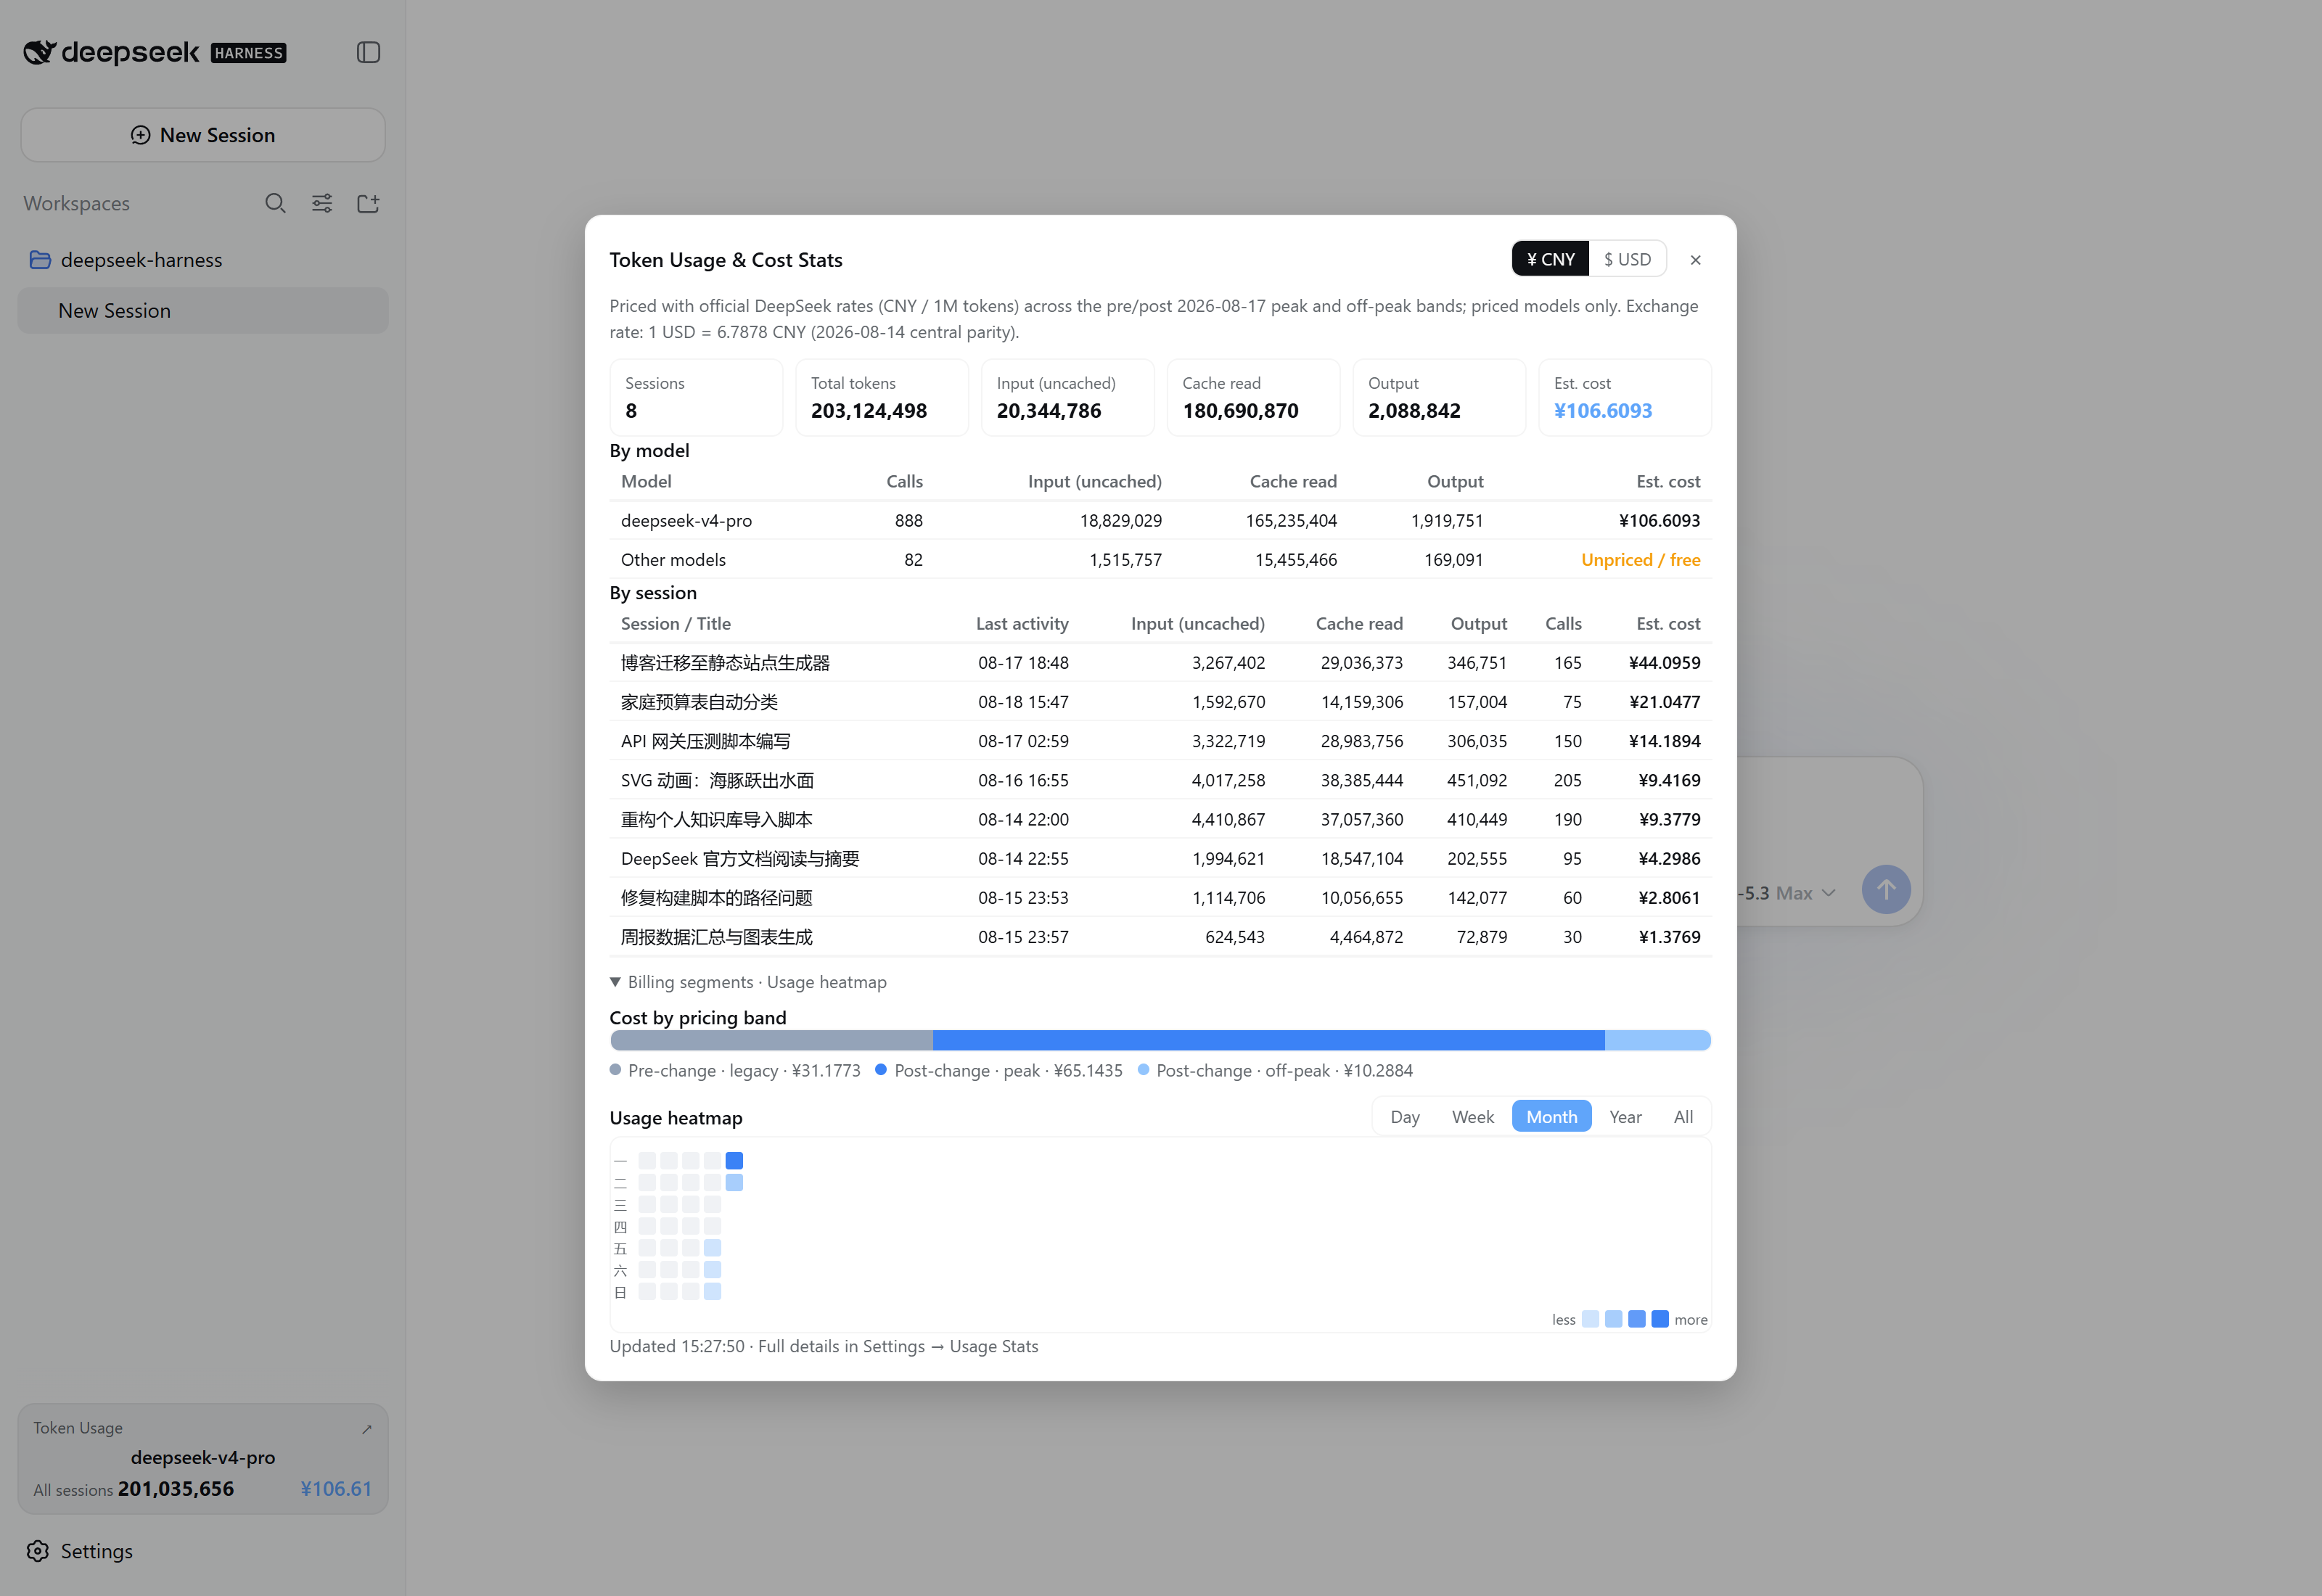
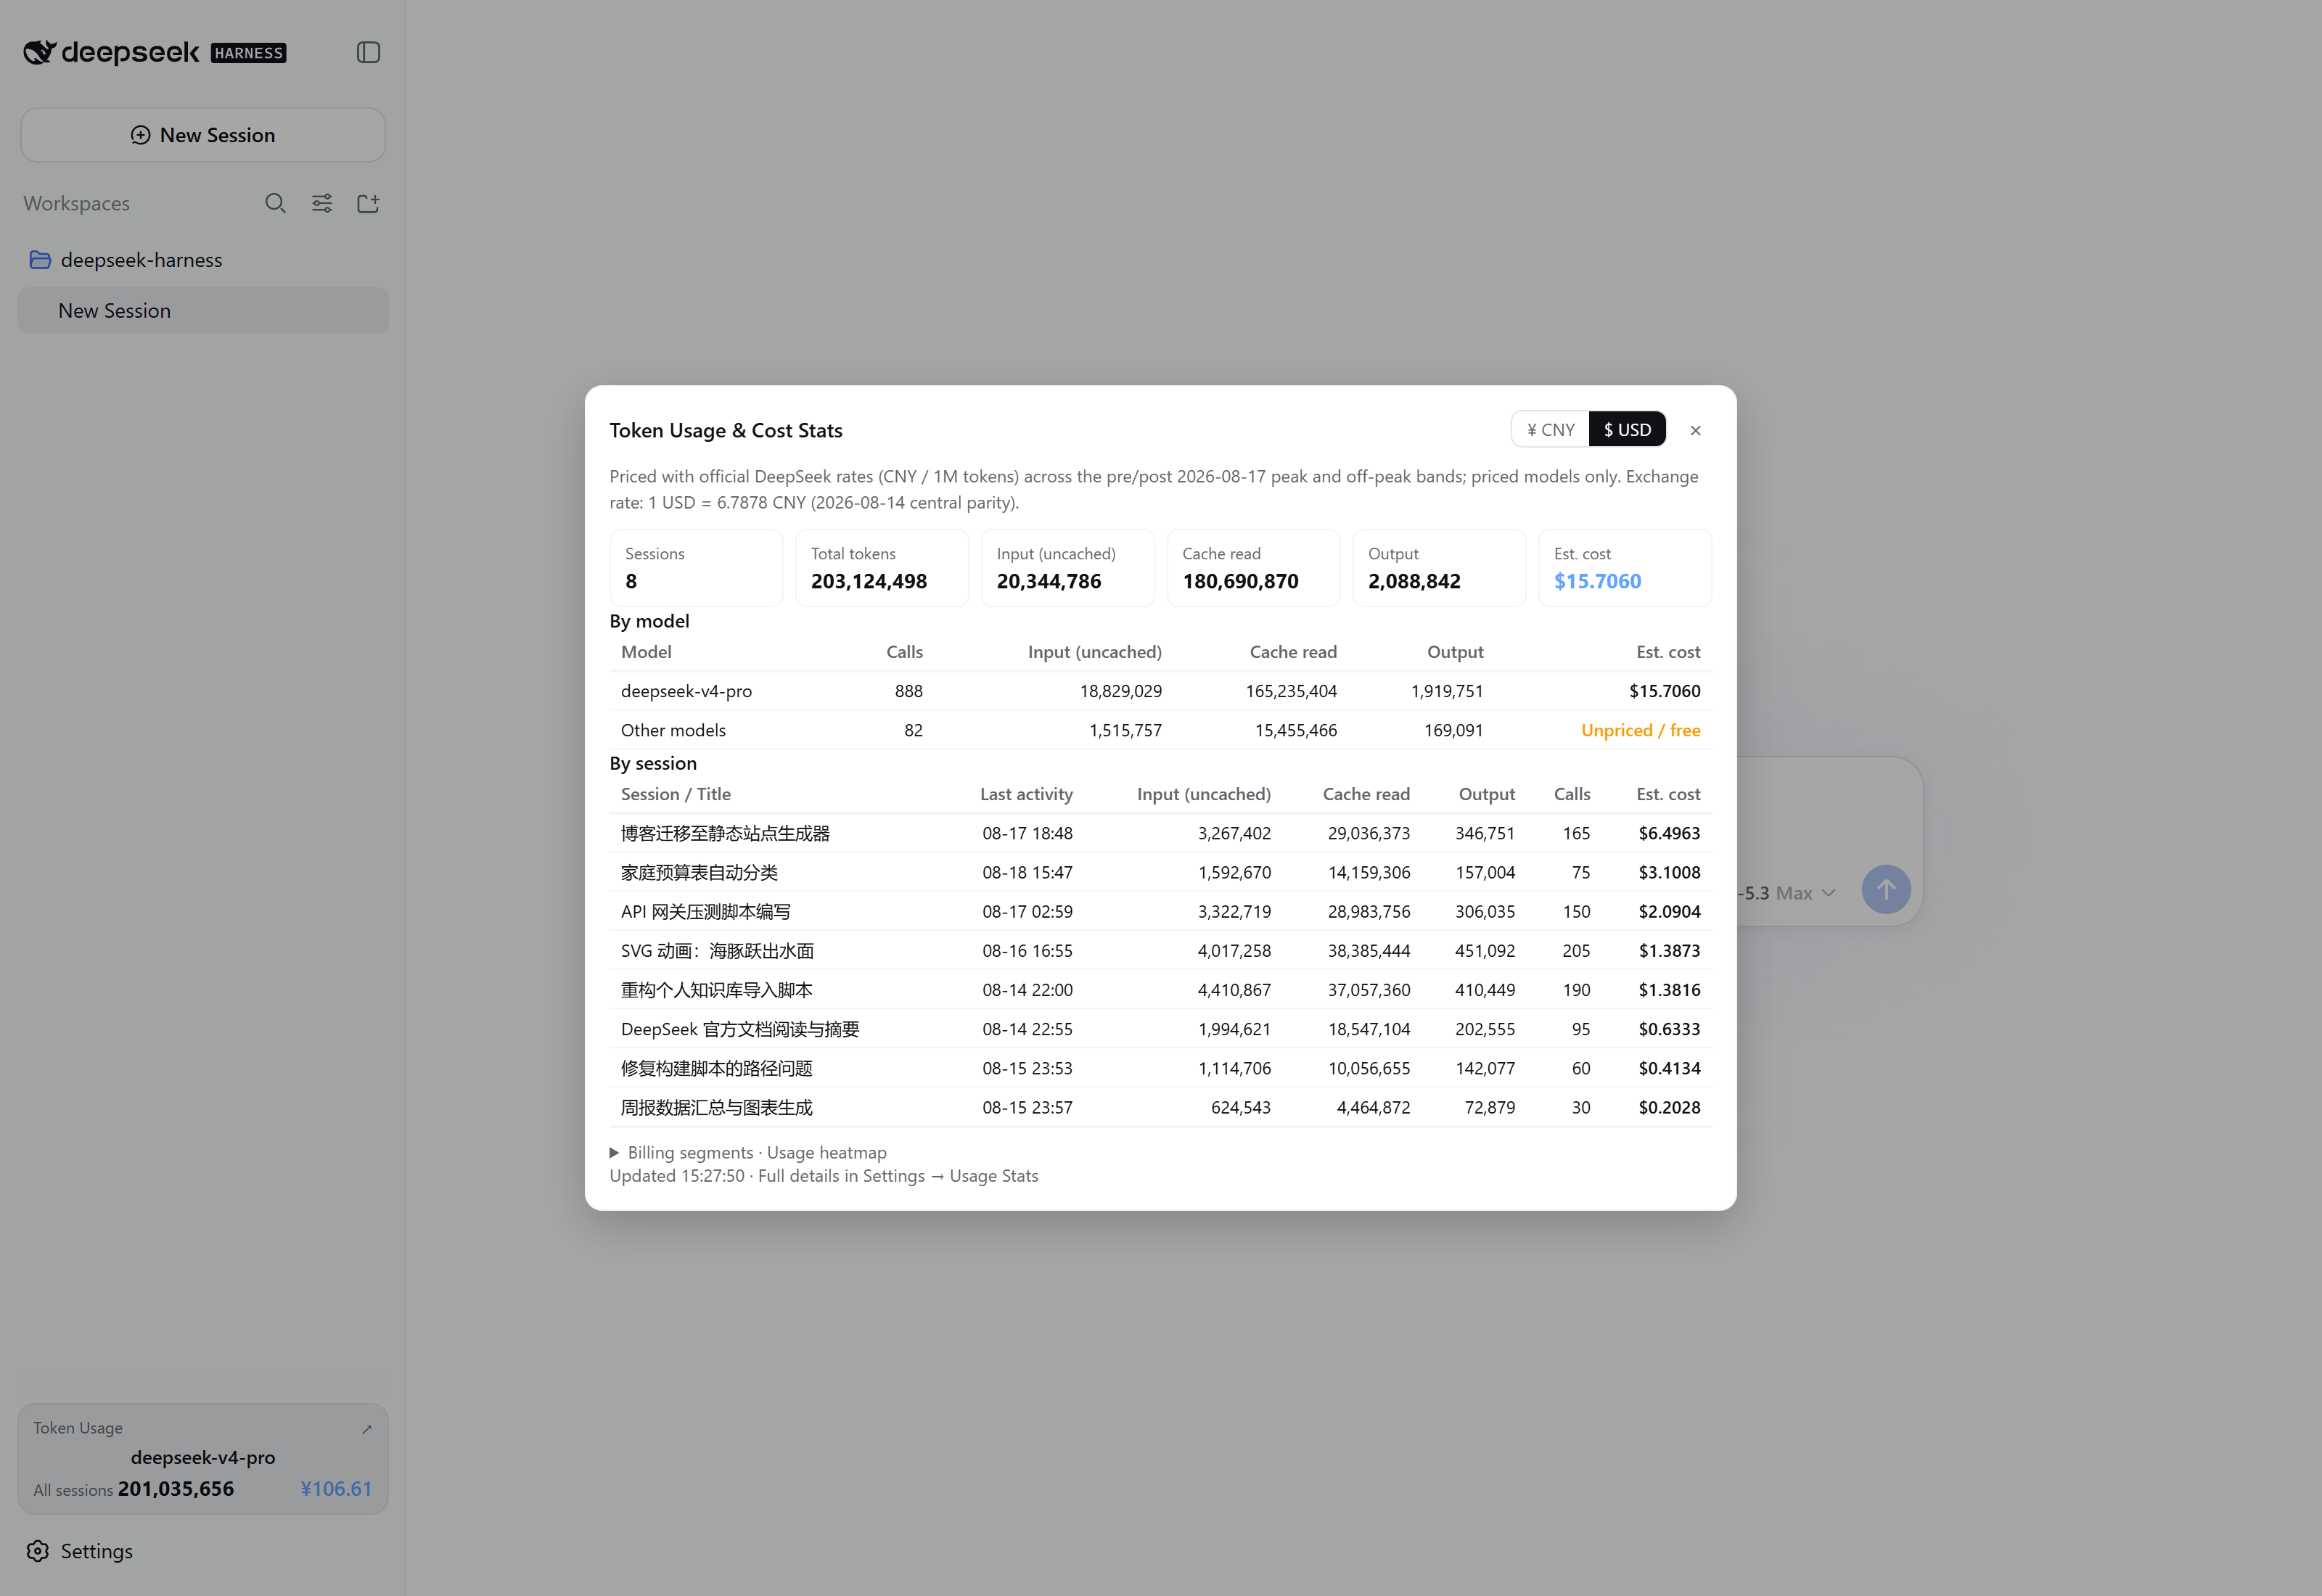
- A "Token Usage" card at the sidebar foot (current model + this-session tokens/cost, thousands-separated) → opens a centered "Token Usage & Cost Stats" dialog (¥/USD currency toggle, overview cards, by-model / by-session tables, budget progress, official balance, billing-segment ratio, usage heatmap)
- A persistent line under the composer showing the current session usage: a ring (daily budget, amber ≥80%, red ≥100%) plus cost/calls/tokens — click to open a detail panel (session cost & today total, billing-band ratio bar, calls/in/cache-hit-rate/out rows, per-band cost, per-model split, daily budget; Esc or outside click dismisses) — interaction and styling match the official ContextMeter
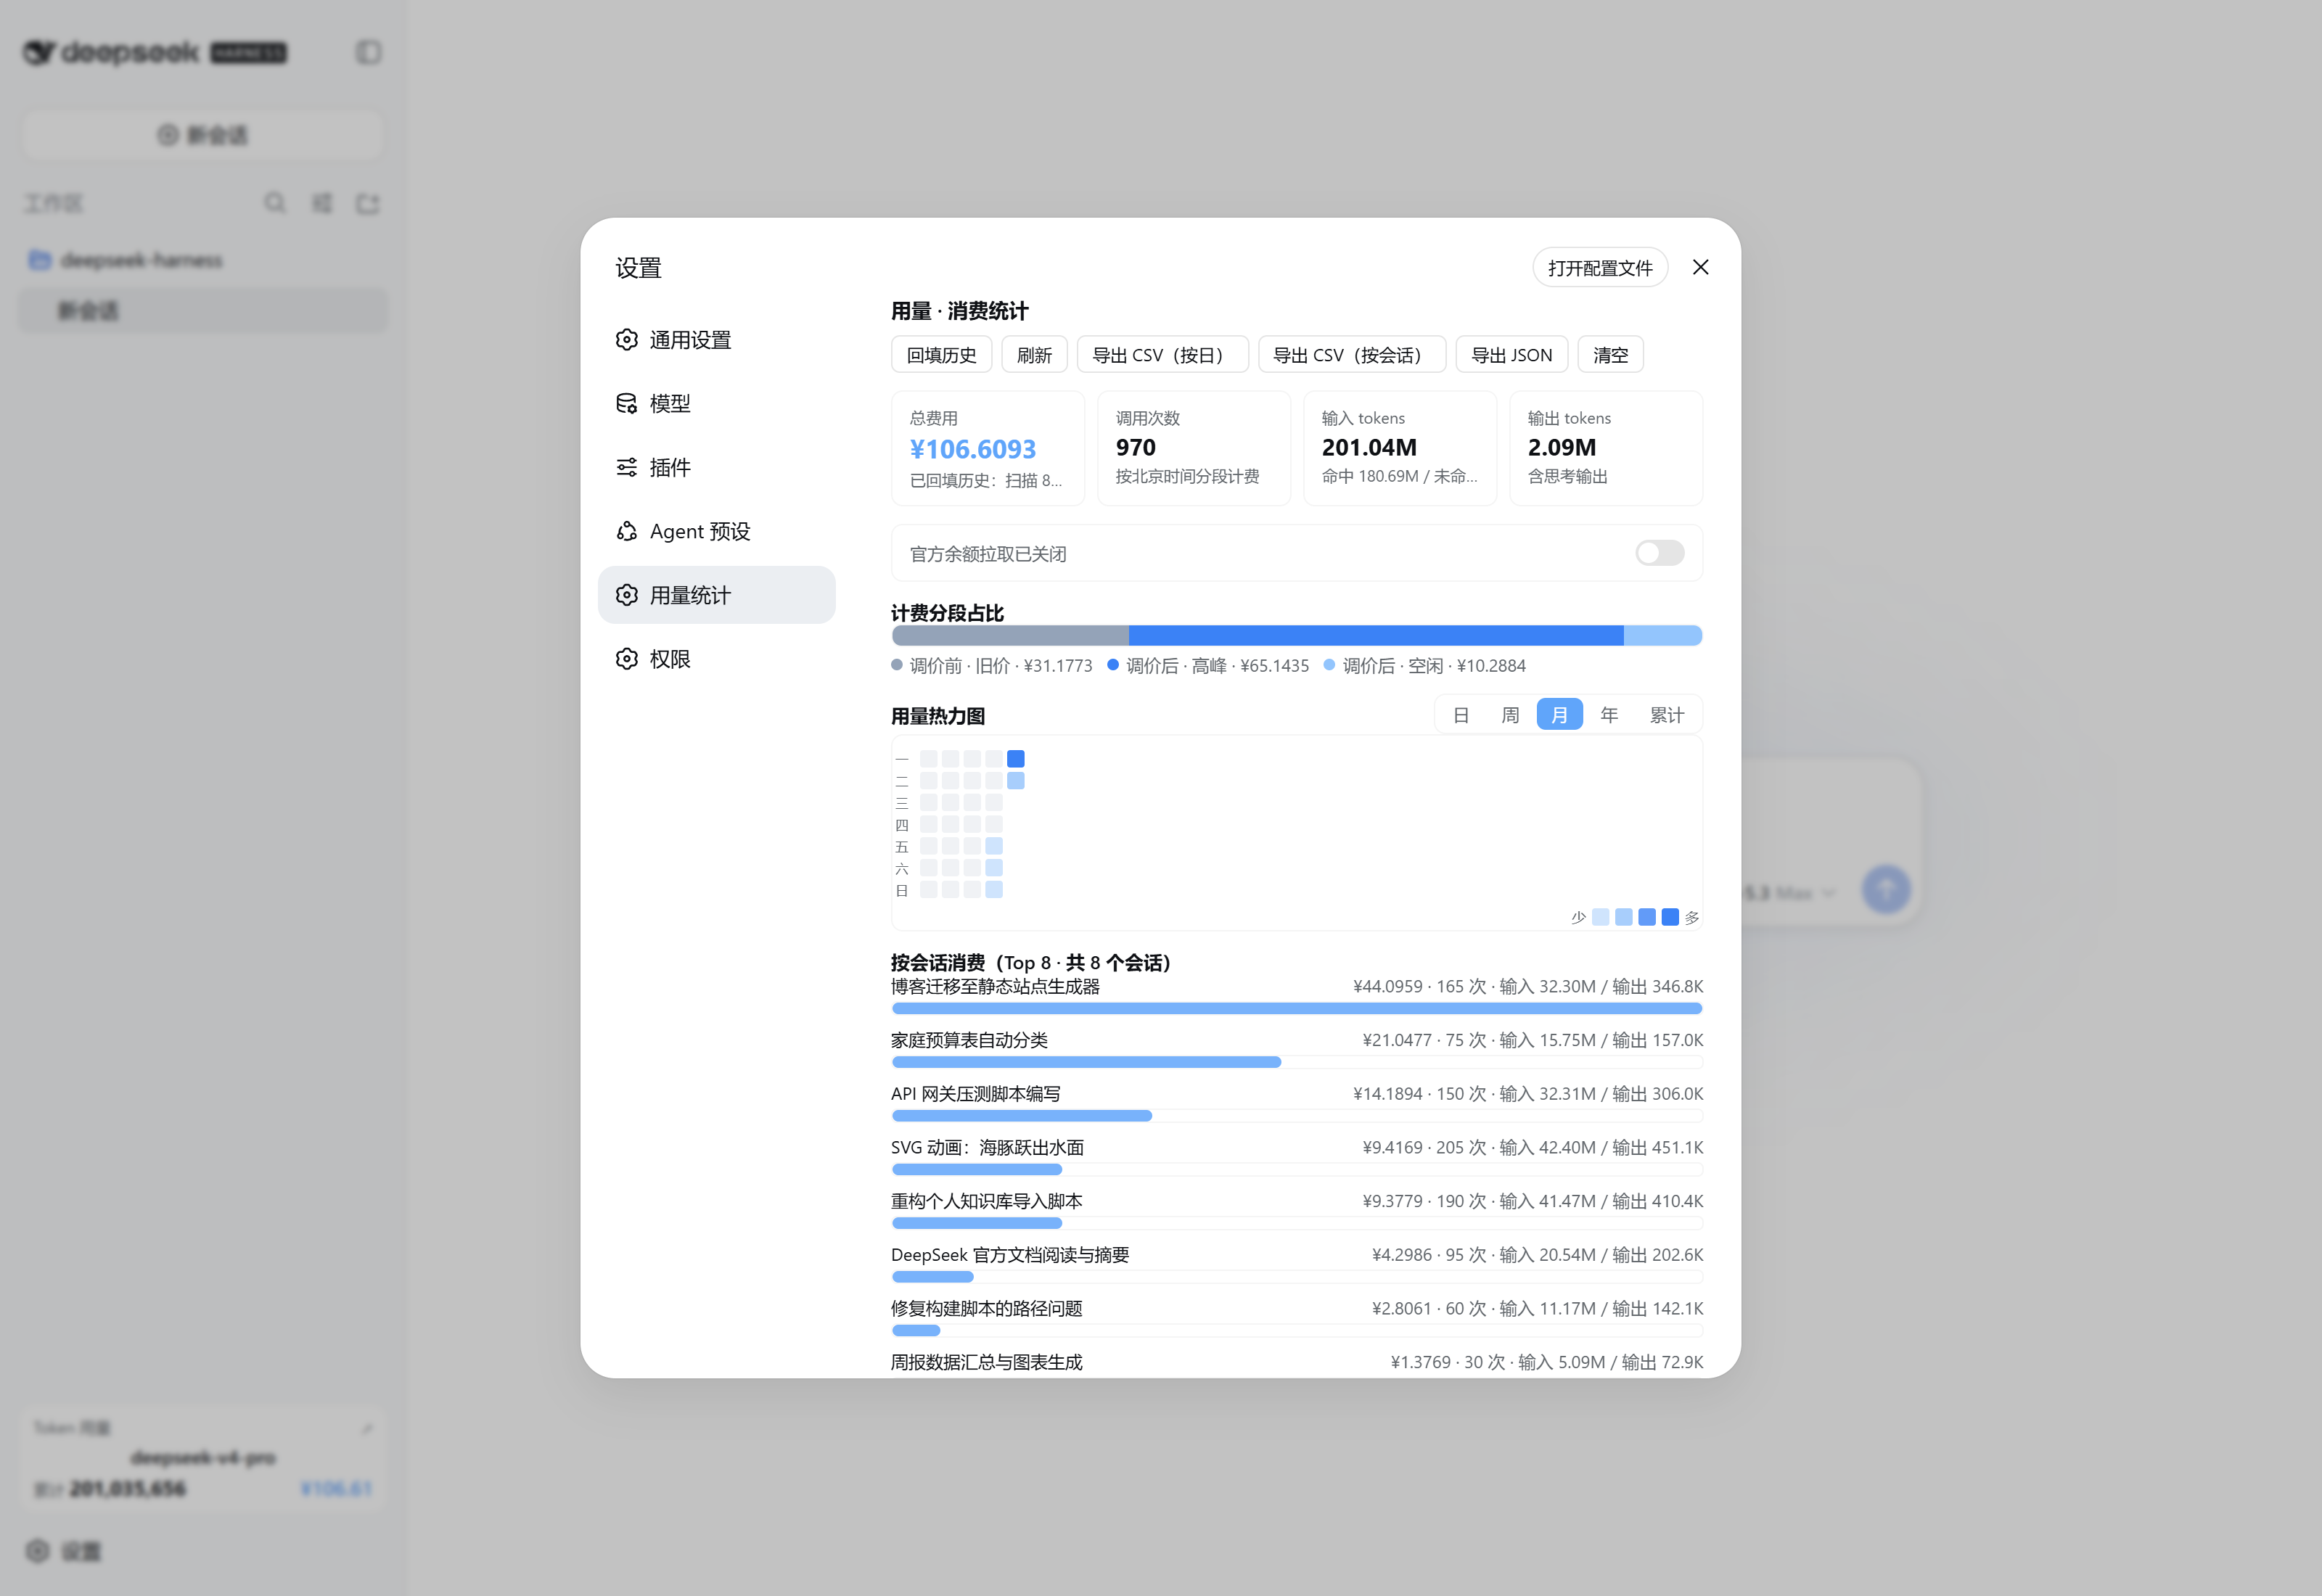
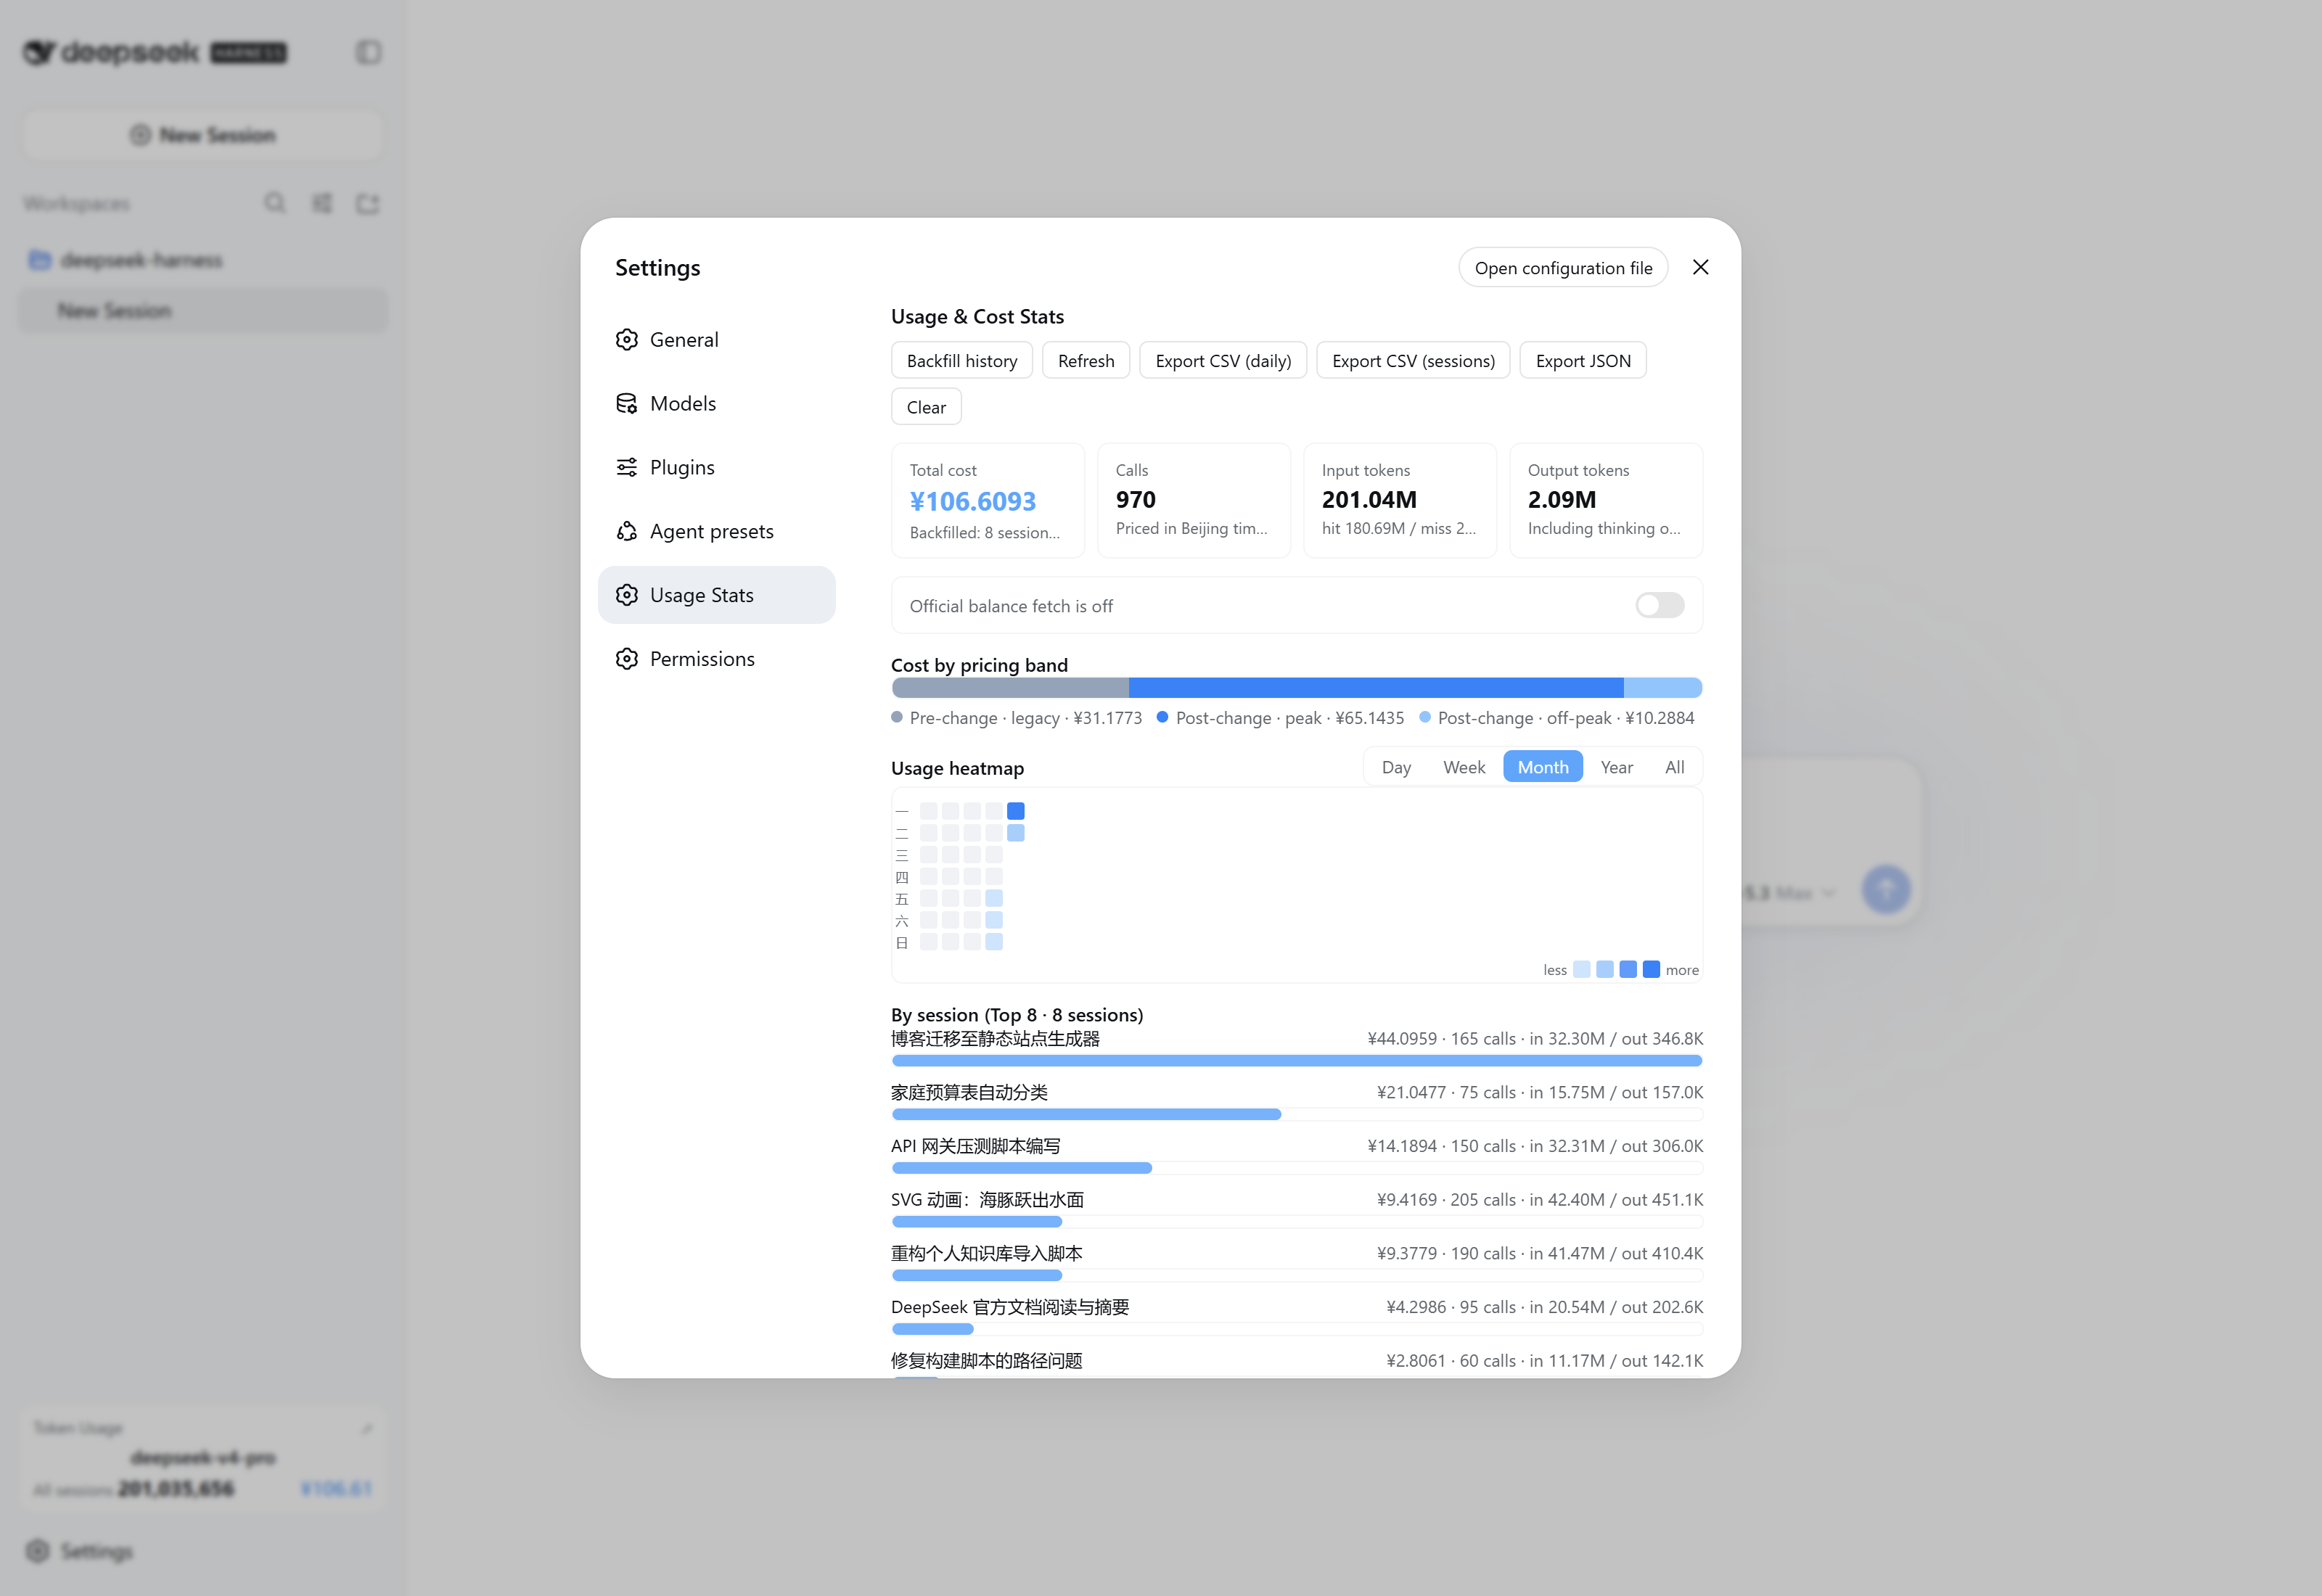
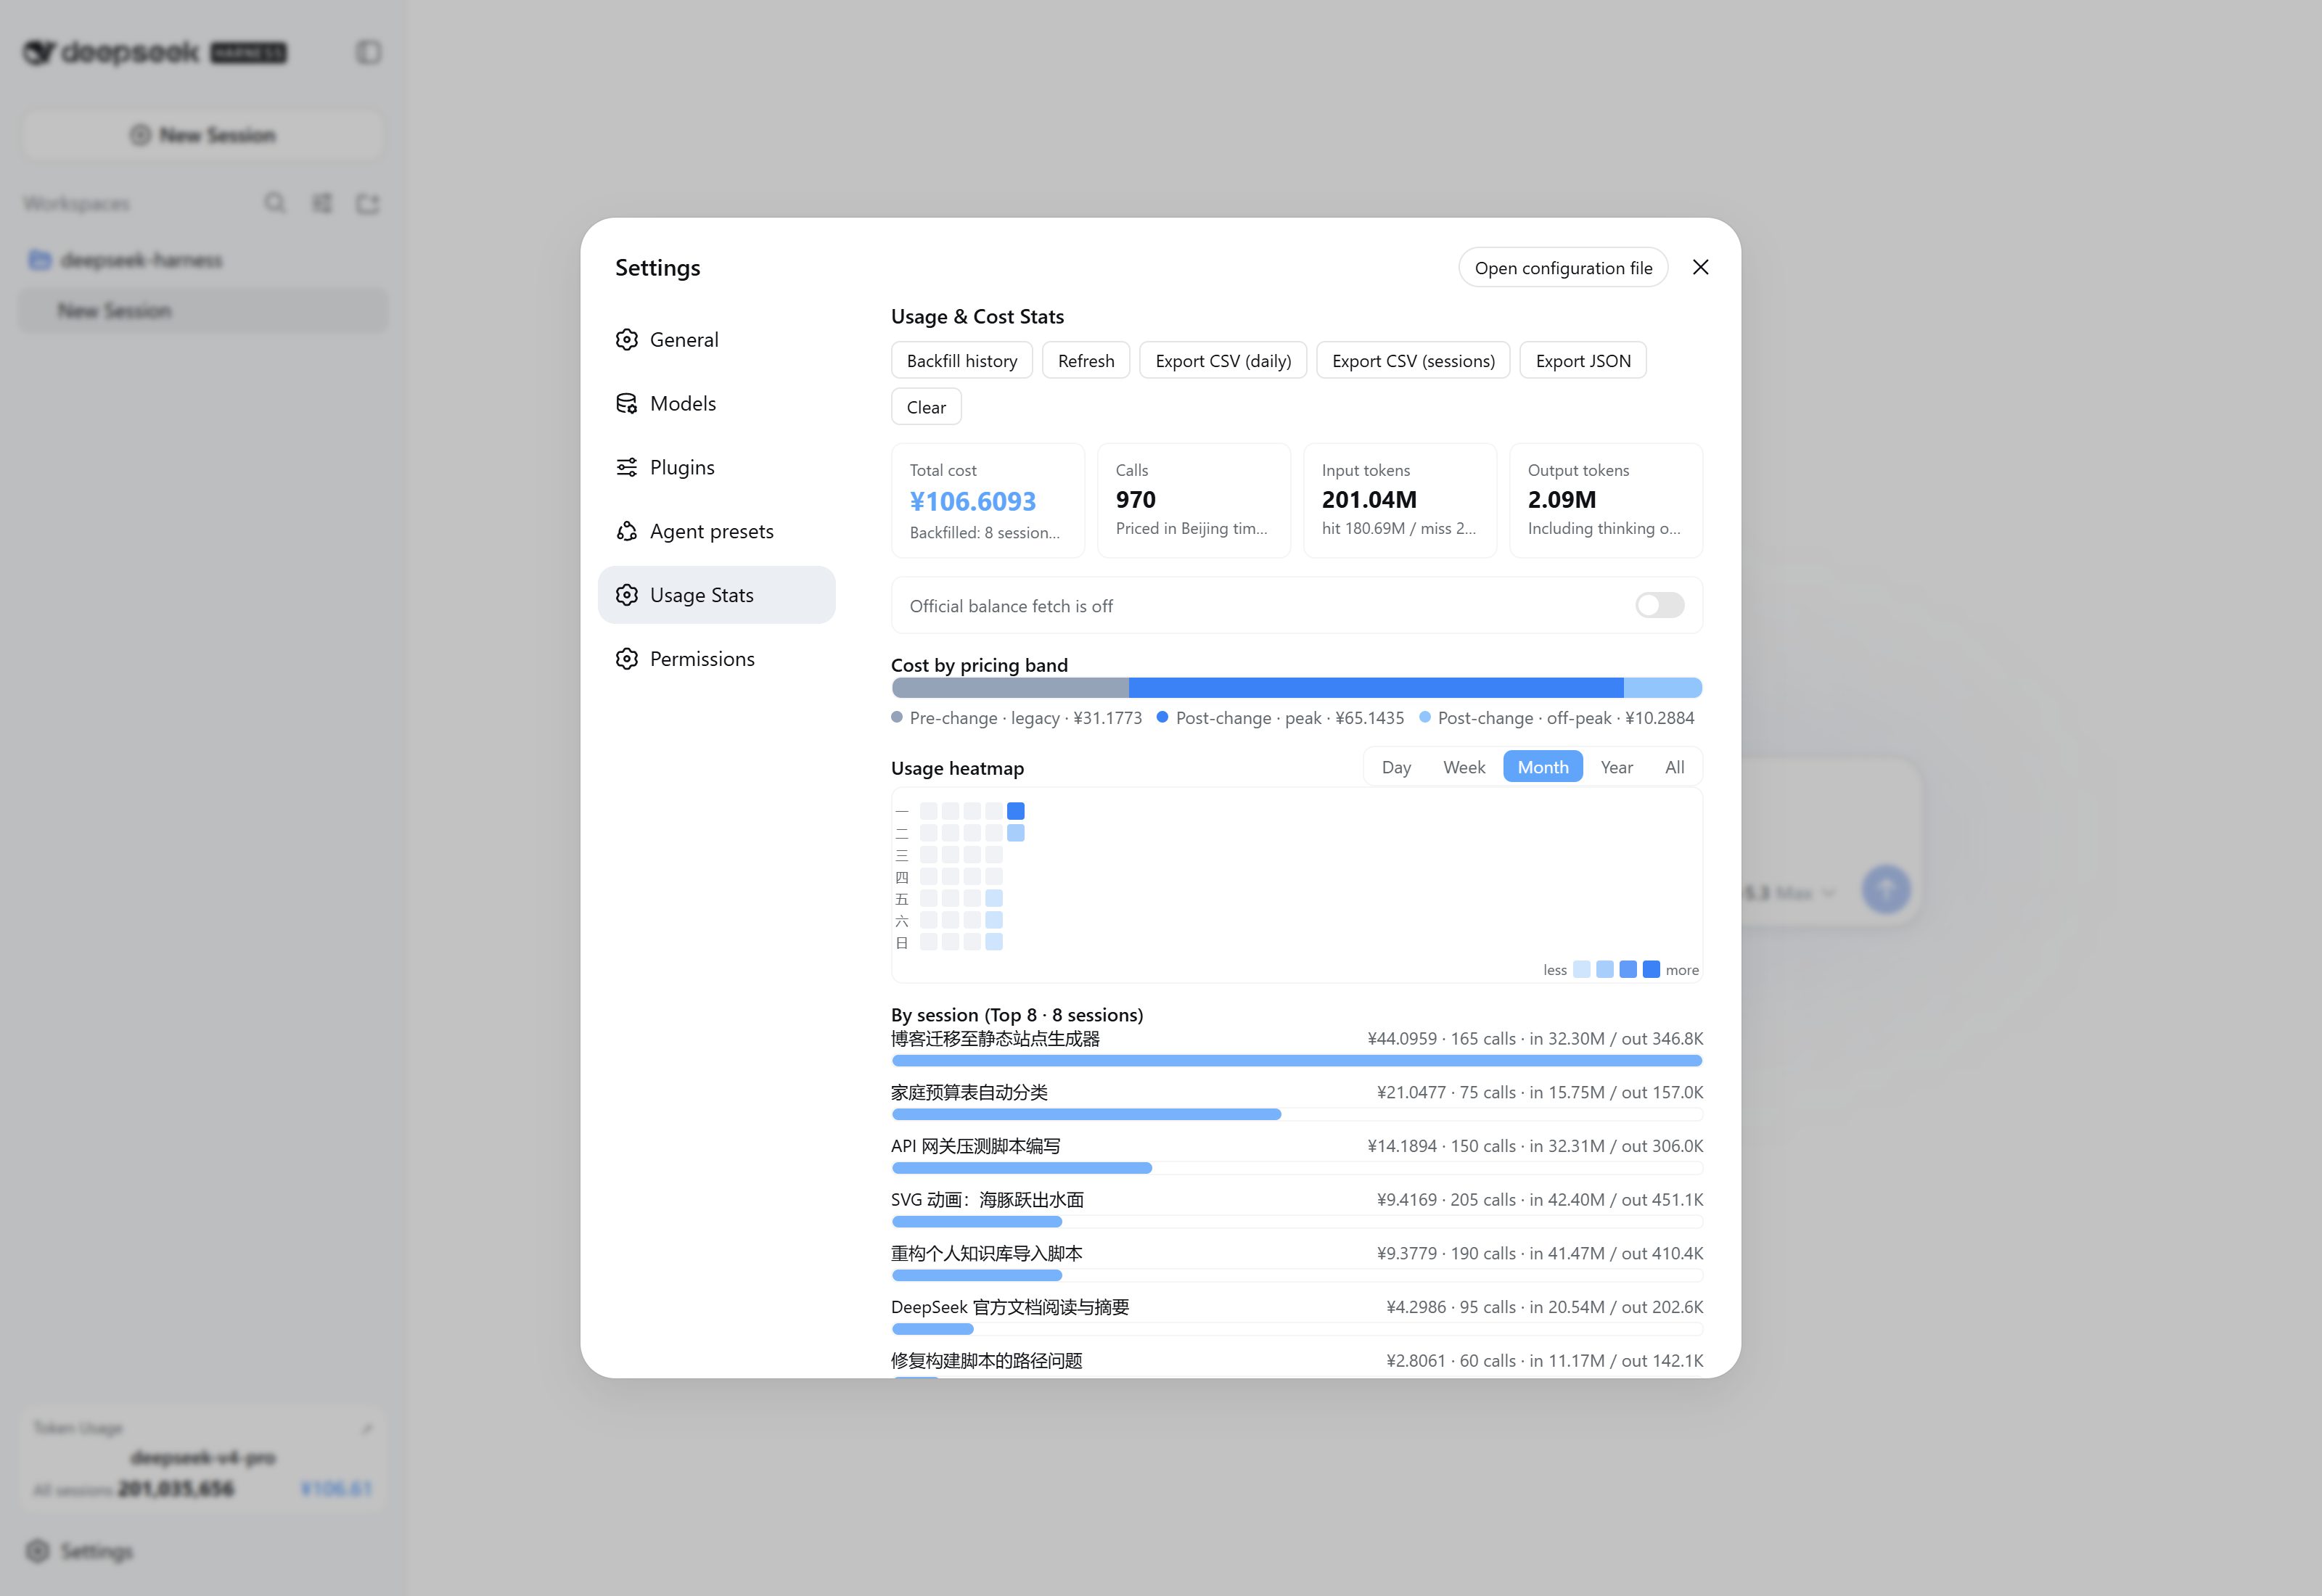
- Settings → Usage Stats: full details (stat cards, budget progress, segment ratio, day/week/month/year/all heatmap with instant hover tooltips, per-session Top 8 (click to open the session), per-model, recent calls, backfill/clear/export, pricing & budget editor)
- **Dynamic tool
usage_billing**: the model can query statistics directly ("how much have I spent?" / "today?" — supports today/month/all scopes) - Persistence: data is written to
.dsh-usage-billing.jsonunder the write-policy root; survives restarts (before v0.5.4:.dsh-usage-stats.json, auto-migrated on upgrade) - Bilingual UI: all panel copy follows the app language setting (Chinese / English) and switches instantly
Screenshots
The screenshots below use fictional demo data.
Stats dialog · overview (opened from the sidebar Token Usage card)
Stats dialog · charts (billing-segment ratio + usage heatmap, with ¥/USD toggle)
USD mode (one-click toggle in the dialog header, exchange-rate converted)
Settings · Usage Stats
Install
Option A: one-line npm install (recommended, prebuilt)
dsh plugin --profile web add dsh-usage-billing
npm package: https://www.npmjs.com/package/dsh-usage-billing
The package auto-mounts at startup through its dsh.bundle.patch (cordis.patch.yml) — no other configuration needed.
⚠ Do not patch official bundles (e.g.
@deepseek-ai/dsh-web-app/cordis.patch.yml) directly, and do not place the plugin inside thenpm-cache\_npxcache (npm reify rebuilds it and leaves dangling links).
A local path works too:
dsh plugin --profile web add <repo path>.
Option B: user patch layer (without touching the profile)
Add the content of the repo-root cordis.patch.yml to:
%USERPROFILE%\.dsh\cordis.patch.yml
- insert:
    - id: usage-billing
      name: 'dsh-usage-billing'
Data & billing
| Data | Location / notes |
|---|---|
| Stats file | .dsh-usage-billing.json under the write-policy root (usually the user home) |
| Billing zone | Beijing time; rate-change boundary 2026-08-17 00:00 |
| Unit | CNY per million tokens |
Price table (CNY per million tokens):
| Period | Model | Cache hit | Cache miss | Output |
|---|---|---|---|---|
| Before 8/17 | flash | 0.02 | 1 | 2 |
| Before 8/17 | v4-pro | 0.025 | 3 | 6 |
| After 8/17 · off-peak | flash | 0.05 | 1.5 | 4.5 |
| After 8/17 · peak | flash | 0.10 | 3.0 | 9.0 |
| After 8/17 · off-peak | v4-pro | 0.15 | 4.5 | 13.5 |
| After 8/17 · peak | v4-pro | 0.30 | 9.0 | 27.0 |
| Since 9/10 12:00 · off-peak | flash | 0.02 | 1 | 4 |
| Since 9/10 12:00 · peak | flash | 0.04 | 2 | 8 |
Models are classified by name substring: names containing
flash(the newdeepseek-flashplus legacydeepseek-v4-flash/deepseek-v4-flash-vision-exp— retired names are served by V4.1-Flash at Flash rates) are billed at flash rates,proat pro rates, others as "unpriced / free".
Reference: DeepSeek API pricing
Holiday billing: the 2026 State Council holiday schedule (holidays plus make-up workdays) is built in; a matching date bills off-peak all day. The "Off-peak dates" editor in settings accepts one
YYYY-MM-DDper line, so the 2027 schedule can be added by hand once published — no plugin release needed.
Structure
.
├── lib/
│   ├── index.js     # Host half: llm/stream tracking, billing, backfill, persistence, /usage-billing route, usage_billing tool
│   └── client.js    # Client half: main-UI entries + settings panel (window.__ModuleLoader__ bundle, build-free)
├── cordis.patch.yml # Bundle patch declaring the mount row (dsh.bundle.patch mechanism)
├── package.json     # exports ("." / "./client" / "./cordis.patch.yml") + dsh.client / dsh.bundle declarations
├── PUBLISH.md       # Publishing guide (GitHub / npm / install)
├── LICENSE
└── README.md
FAQ
- Doubled stats: older versions rebuilt without clearing first; since v0.2.0 a
schemaVersionmigration marker triggers a single clean rebuild on restart. - Panel not showing: the client bundle is discovered by the deployment's
clientModulesservice; restart the app and refresh the page after first install. - Two instances at once: the stats file is a shared resource and concurrent writes overwrite each other — keep a single instance.
- Overwritten by upgrades: redeploying the app directory overwrites built-in patch lines and package files; re-run the install step.
- dsh version compatibility: verified against 0.1.2-alpha.1 through 0.1.6-alpha.2 (since 0.1.6
sessions.openis gone; session navigation automatically usesuiWorkspace.openSessionwith a fallback for older runtimes — no version-specific install needed).
License
MIT
Comments
Comments live in GitHub Discussions. Sign in with GitHub to post or react.